SPSS Data Analysis
- Load Sample Data into ATSD
- Import Data into SPSS
- Merge Datasets
- Analyze Dataset
- Export Derived Series into ATSD
- Verify Insertion
- Exporting Data into CSV Files
Overview
The IBM Statistical Package for the Social Sciences 24 (SPSS) is an advanced statistical analysis tool. This guide describes the process of loading data from ATSD into SPSS and demonstrates how to calculate the value of a derived series using Weighted Consumer Price Indices as an example.
SPSS provides several options for loading datasets from external data sources, such as Excel files or remote databases. To complete this exercise, sample data must be available in your instance of ATSD.
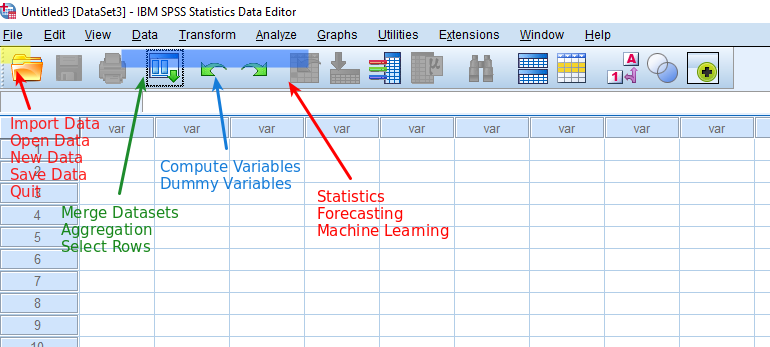
SPSS Interface
| Menu Item | Description |
|---|---|
| File | Import data from files, create and save datasets, connect to databases. |
| Data | Prepare datasets: select rows, aggregate, merge, split. |
| Transform | Transform data: calculate new variables, convert dataset into time series or other data structure. |
| Analyze | Apply statistical functions to the dataset. |
Load Sample Data into ATSD
- Log into the ATSD web interface
- Open Metrics > Data Entry, open the Commands tab.
- Copy the
seriescommands into the form and click Submit.
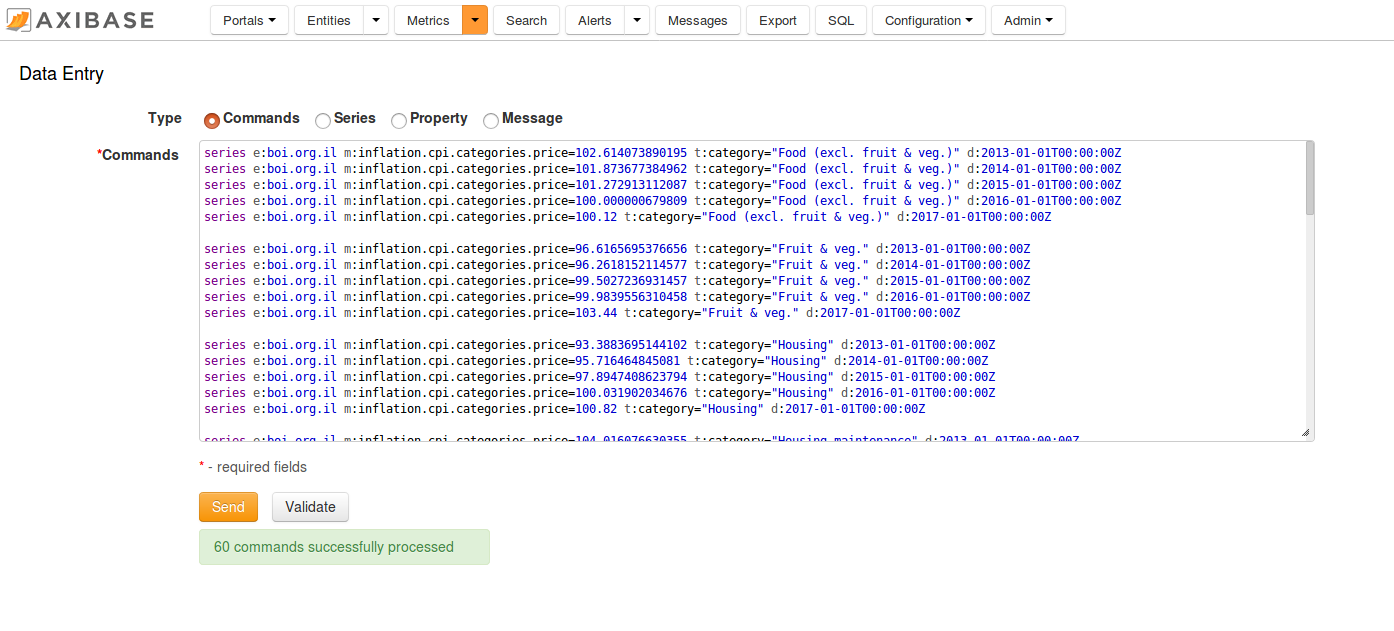
The commands contain the Consumer Price Index (CPI) for each category of items in a consumer basket as well as a weight for each category in the CPI basket. The CPI is tracked from 2013 to 2017 and uses Year 2016 values as the baseline. Weight values are available for 2017. The underlying data is available in the following Excel file.
To calculate the weighted inflation index we need to multiply the CPI of each category by its weight divided by 1000 and sum the products.
Import Data into SPSS
You can import ATSD data into SPSS by configuring an ODBC data source on a Windows machine and retrieving the records with an SQL query. Alternatively, you can run the queries in the SQL Console, export query results into CSV files, and manually load them into SPSS from the local file system.
Import Data from Database
Prerequisites
Configure an ODBC-JDBC bridge for ATSD:
- Specify URL property
compatibility=odbc2:jdbc:atsd://atsd_hostname:ATSD_PORT;compatibility=odbc2.
- Specify URL property
Disable UNICODE mode:
- Launch SPSS Statistics.
- Do not open any existing data file.
- Select the Edit menu.
- Select the Options menu.
- Open the Language tab.
- In the section labeled Character Encoding for Data and Syntax, select Locale writing system
Option 1: Load Prices and Weights As Separate Datasets
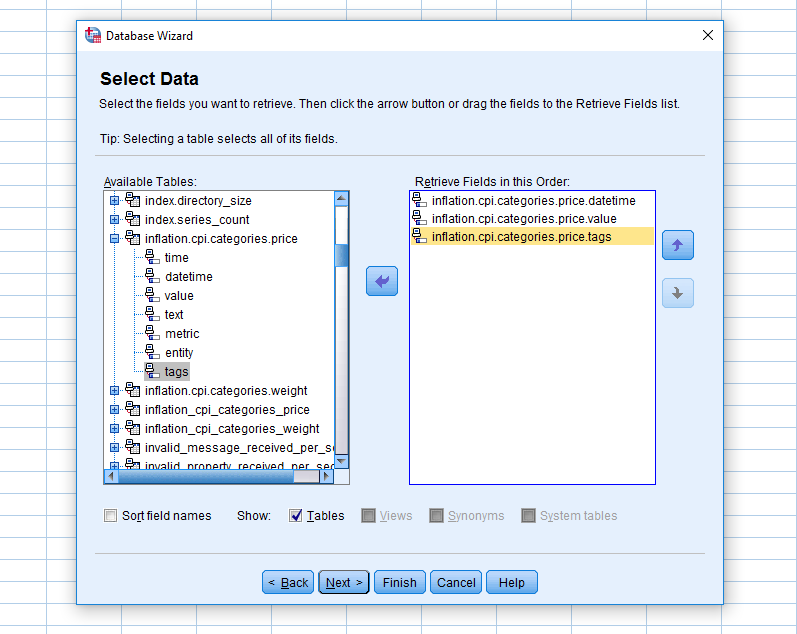
- Open File > Import Data > Database > New query....
- Select
inflation.cpi.categories.pricetable, drag-and-dropdatetime,valueandtagsinto the list of selected columns. - Click Finish.
- Save the imported data into the
prices.savfile.
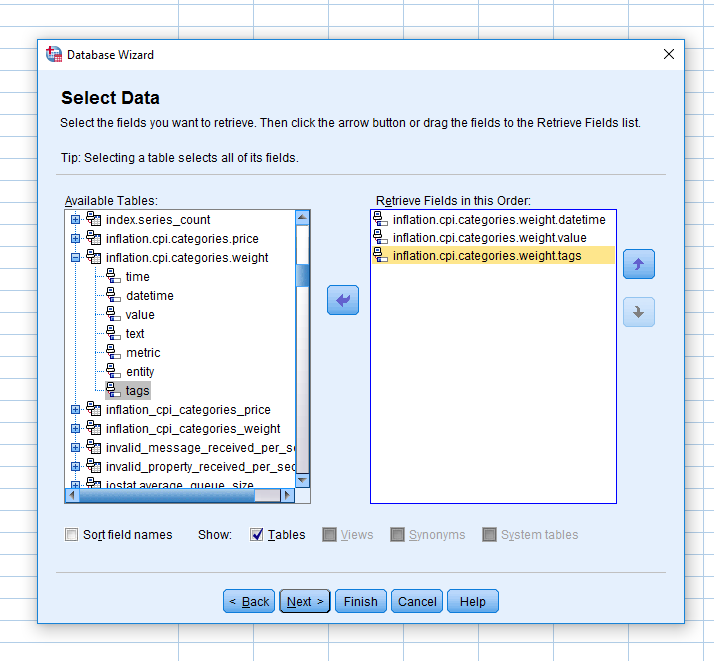
- Open File > Import Data > Database > New query....
- Select
inflation.cpi.categories.weighttable, drag-and-dropdatetime,valueandtagsinto the list of selected columns. - Click Finish.
- Save the imported data into the
weights.savfile.
Alternatively, you can execute SPSS scripts to load records from a data sources automatically.
- Proceed to the Merge Datasets section below.
Option 2: Loaded Merged Prices and Weights Dataset
- Open File > Import Data > Database > New query....
- Select the
datetimecolumn from both theinflation.cpi.categories.priceandinflation.cpi.categories.weighttables.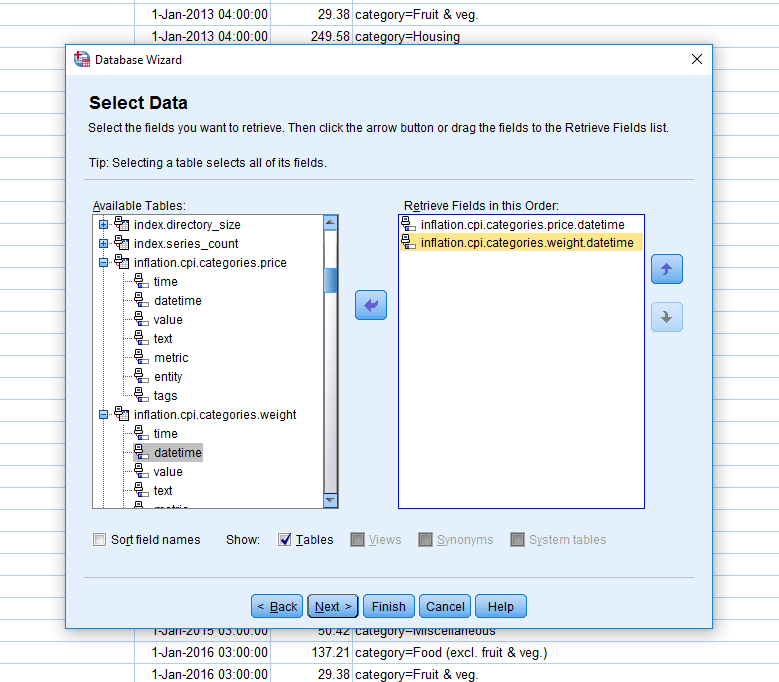
- Skip the next steps until a query editor is displayed.
- Enter a
FULL OUTER JOINquery to fill gaps with interpolated records:
SELECT T0."value" AS price,  T1."datetime" AS datetime, T1."value" AS weight, T1."tags" AS tags
FROM "inflation.cpi.categories.price" T0
  OUTER JOIN "inflation.cpi.categories.weight" T1
WHERE T0.datetime BETWEEN '2013-01-01T00:00:00Z' AND '2017-01-01T00:00:00Z'
  WITH INTERPOLATE (1 YEAR, PREVIOUS, INNER, TRUE)
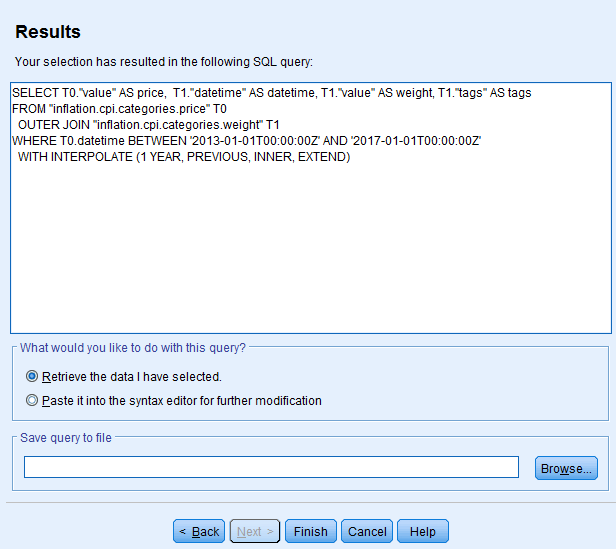
- Click Finish.
- Save the dataset as
prices_merged.sav.
- Proceed to the Analyze Dataset section below.
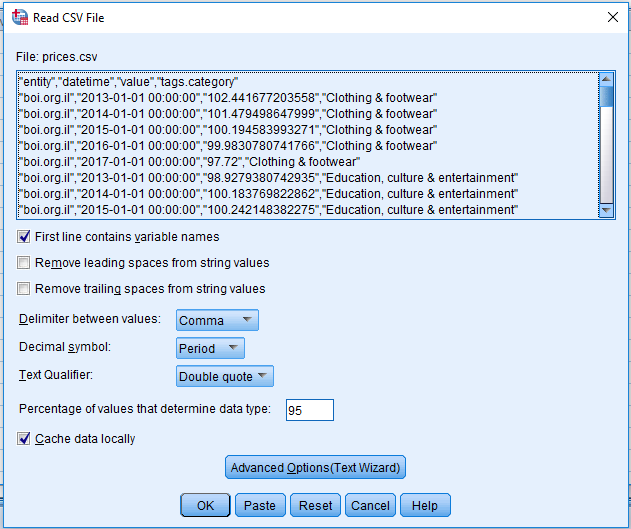
Import from CSV Files
- Export data from ATSD into CSV files as described in Exporting Data into CSV Files.
- Open File > Import Data > CSV Data....
- Select CSV files and click Open to import the
prices.savandweights.savfiles.
Data from the CSV files are now available as SPSS datasets prices.sav and weights.sav. Proceed to merge datasets.
Merge Datasets
Change Names of Columns
SPSS merges datasets using equal column names, similar SELF JOIN in SQL.
To prevent the datetime and value columns from being merged, their names must be changed in the weights.sav dataset using Variable View tab, otherwise the merged dataset produced by SPSS contains data only for 2017.

Also rename value to price in the prices.sav dataset.
Merge
Merge the two datasets by adding the weight column from the weights.sav dataset to the prices.sav dataset.
Open Data > Merge Files... > Add Variables...
Select
weights.savdataset.Check Match cases on key variables.
Select
timein the New Active Dataset pane, add to Key Variables Pane.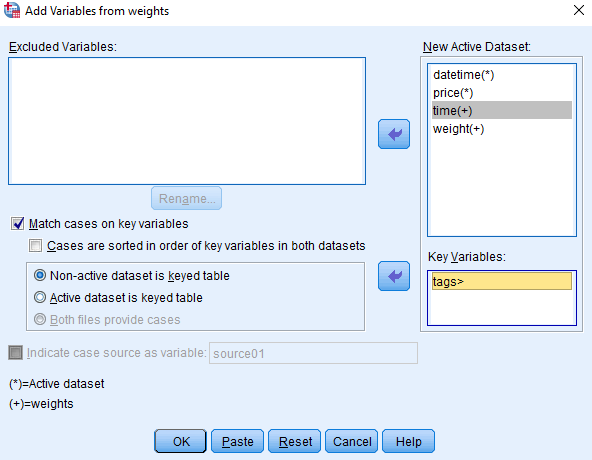
Click OK.
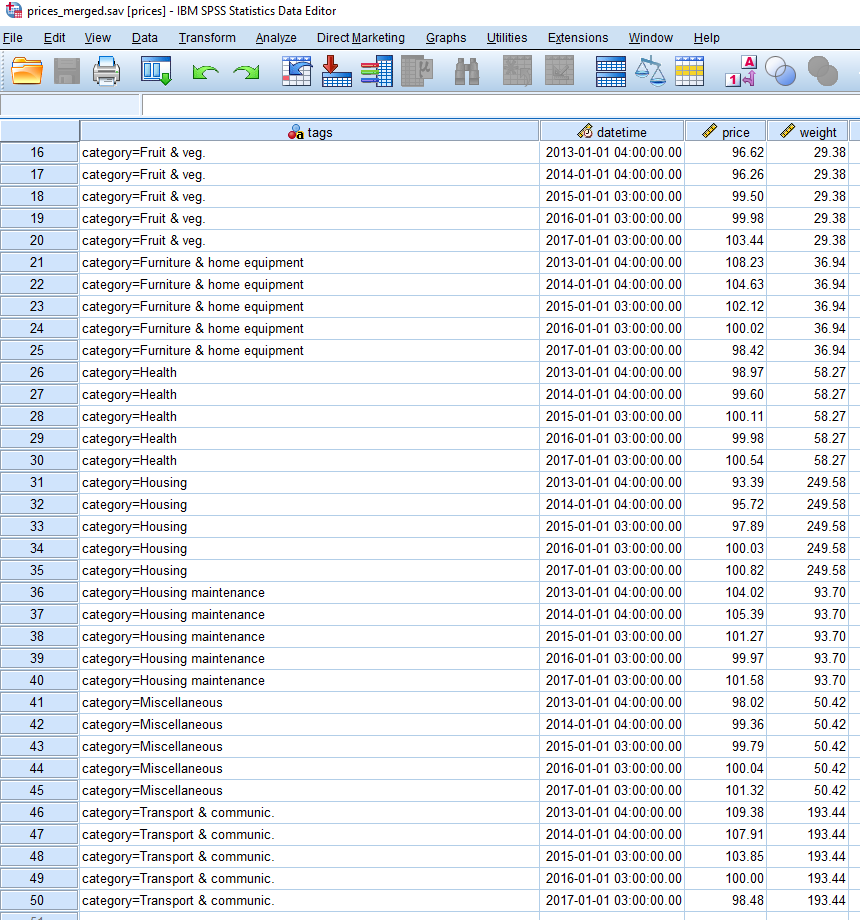
Remove
timecolumn using Variable View.
![]()
Save the merged dataset as a new file prices_merged.sav.
Analyze Dataset
To calculate the weighted CPI for each year, the CPI value for a given category must be multiplied by its weight and divided by 1000. The resulting products are summed to give the value of the weighted CPI.
Calculate Weighted CPI per Category
Open the prices_merged.sav dataset and create the new column categ_index.
- Open Transform > Compute Variable...
- Place the columns from the left into the expression editor and specify a formula.
- Select the
priceandweightcolumns, divideweightby 1000 and multiplypriceby the adjustedweight. - Assign a name to the new column.
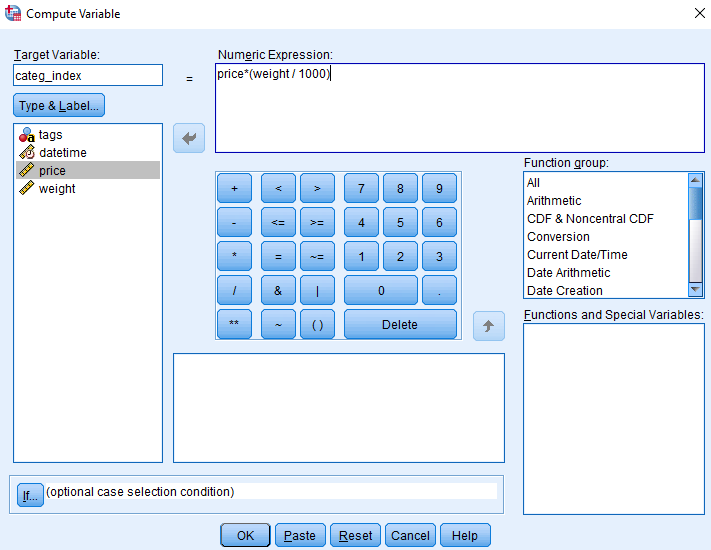
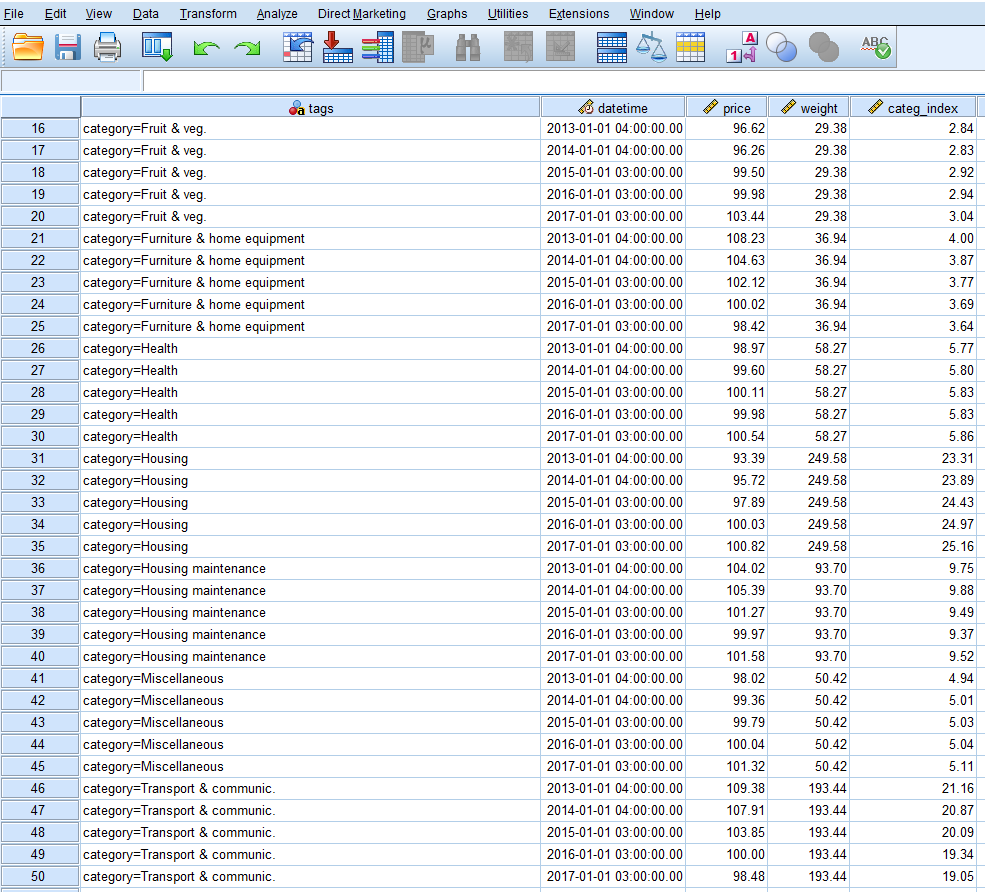
The categ_index column is now available in the dataset.
Calculate Annual CPI
SPSS provides two alternatives to aggregate data by period.
Aggregation using the Analyze Menu
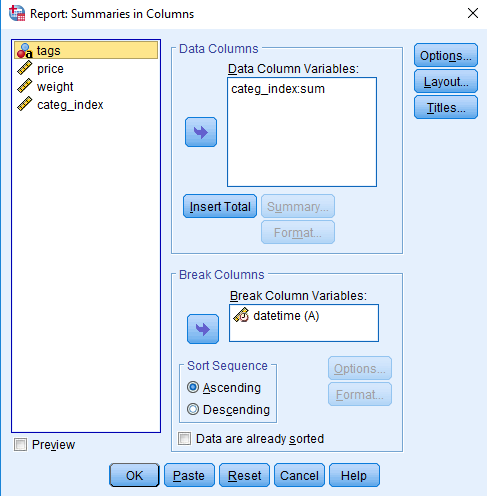
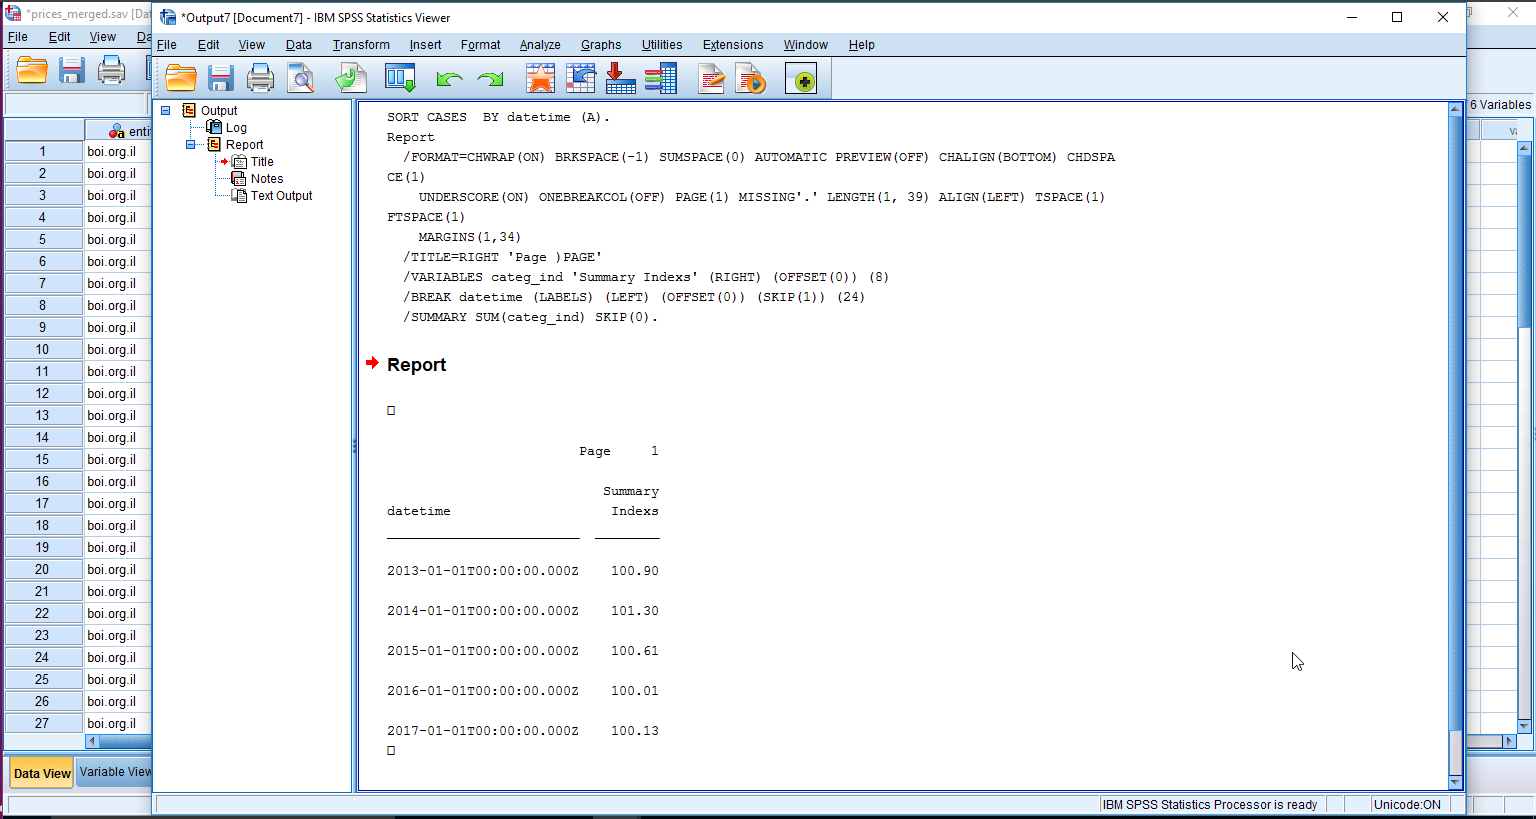
- Open Analyze > Reports > Report Summaries in Columns...
- Move the
categ_indexcolumn to the Summary Variables field and select theSUMaggregation function. - Set the
datetimecolumn as the break variable, which is used to group the resulting data. You can format aggregation columns in the dialog window.
Publish the report by selecting File > Export As a Web Report in the output window.
The output contains the processing log in the results window.
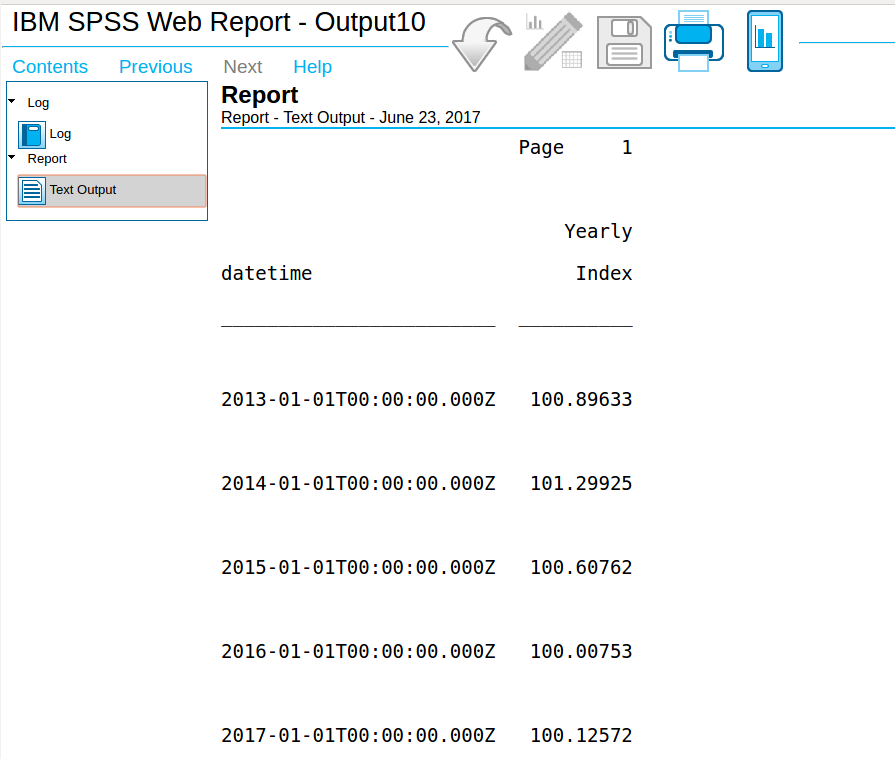
The report is also available in HTML format.
Aggregation using the Data Menu
Open Data > Aggregate....
Set
categ_indexas the summary variable and apply theSUMfunction.Set
datetimeas the break variable.Customize column formats and output options.
Create a new dataset with the break and aggregated variables.
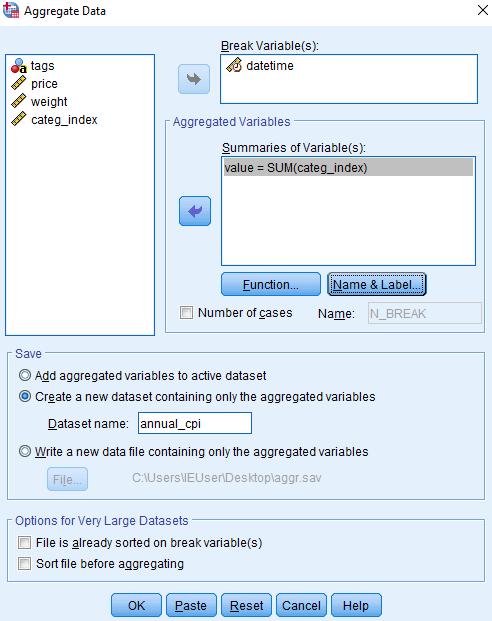
Create a new dataset with final columns
datetimeandvalue.
Export Derived Series into ATSD
Create a new metric in ATSD to store new series calculated in SPSS.
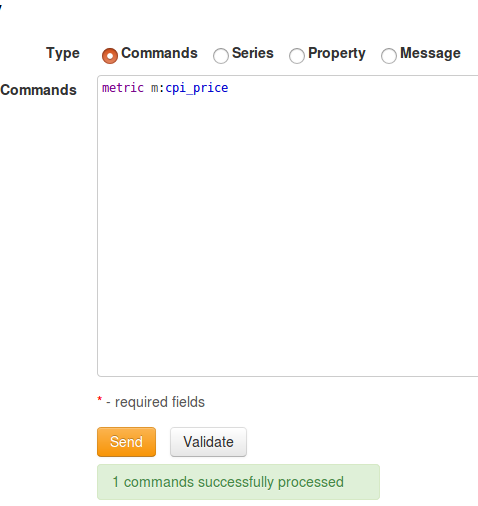
- Log in to ATSD, open the Metrics > Data entry page and send a
metriccommand.
metric m:cpi_price
Open the previously created dataset in SPSS.
Select Transform > Compute Variable...
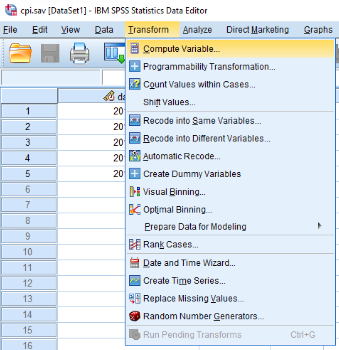
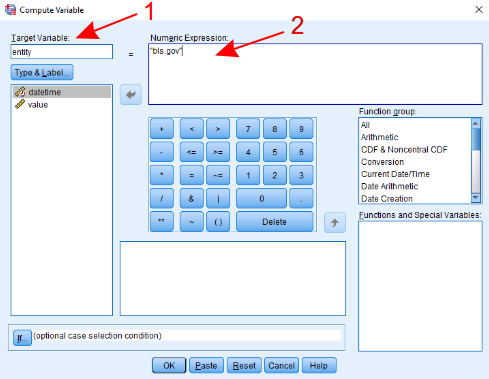
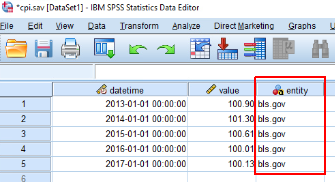
- Enter
entityin the Target Variable field. - Enter
"bls.gov"in the Numeric Expression field.
- Enter
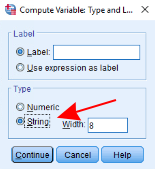
- Click Type & Label....
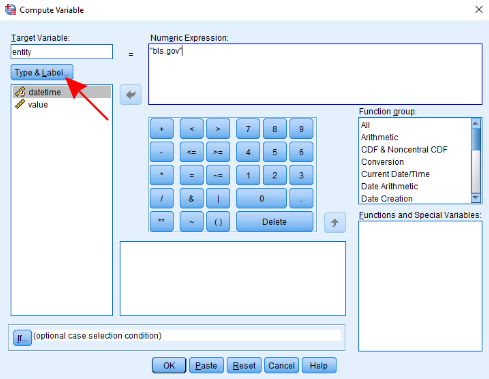
- Set Type to String and click Continue.
- Click OK to apply the changes. Column
entitynow appears in the dataset.
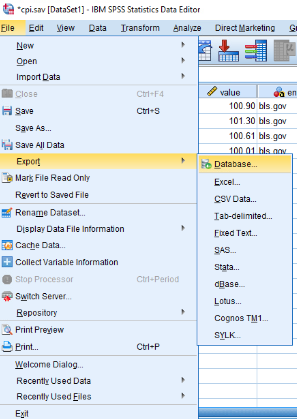
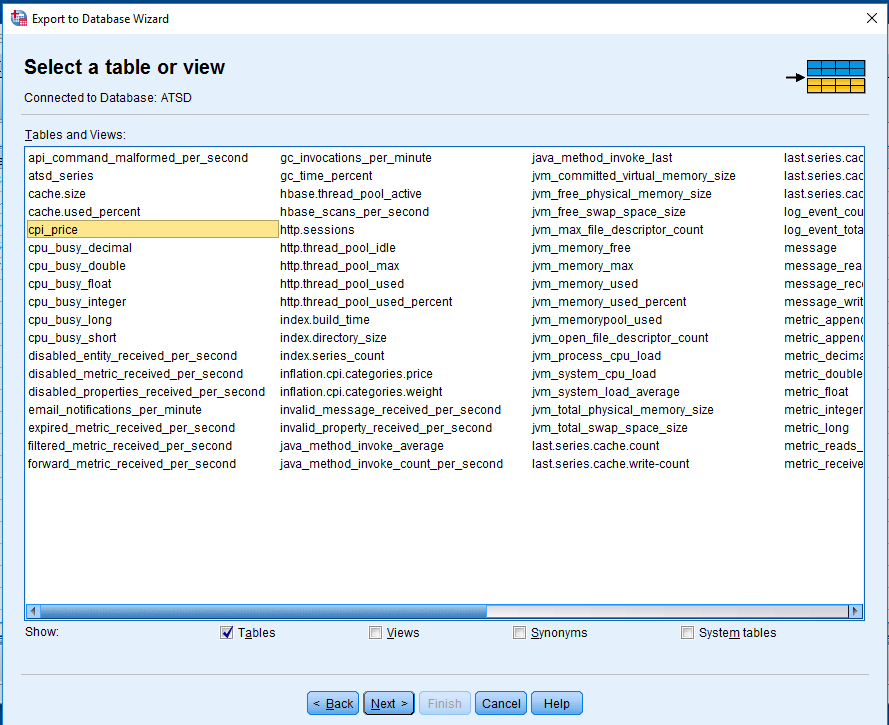
- Open the File menu and select Export > Database....
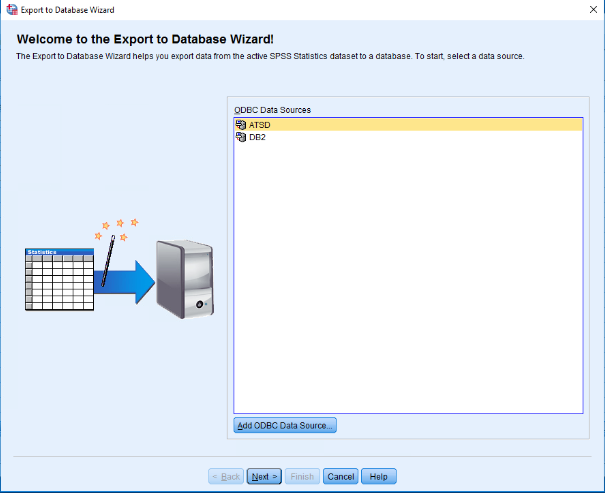
- Select
ATSDdata source, click Next.
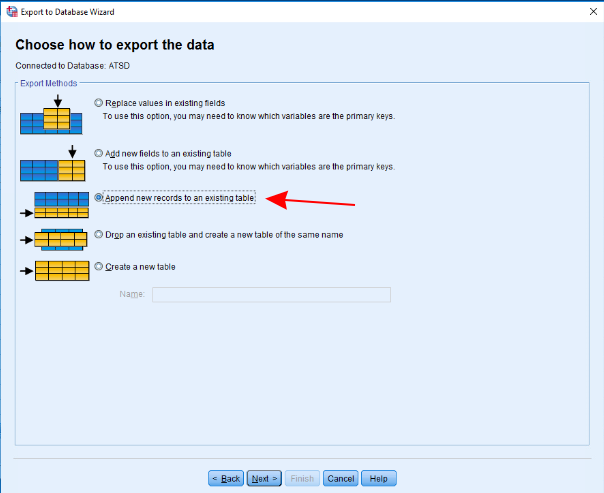
- Select Append new records to an existing table and click Next
- Choose
cpi_pricetable and click Next. The list of tables is based on thetables=driver property specified in the JDBC URL. If you do not see the table in the list, update ODBC data source as described here and re-open the export wizard.
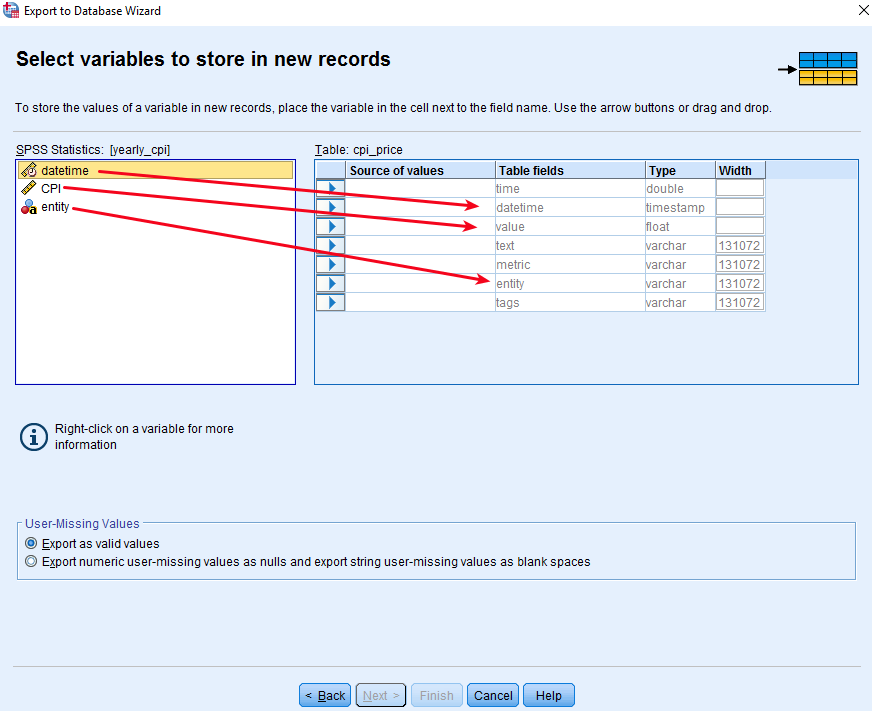
- Associate table columns with metric fields.
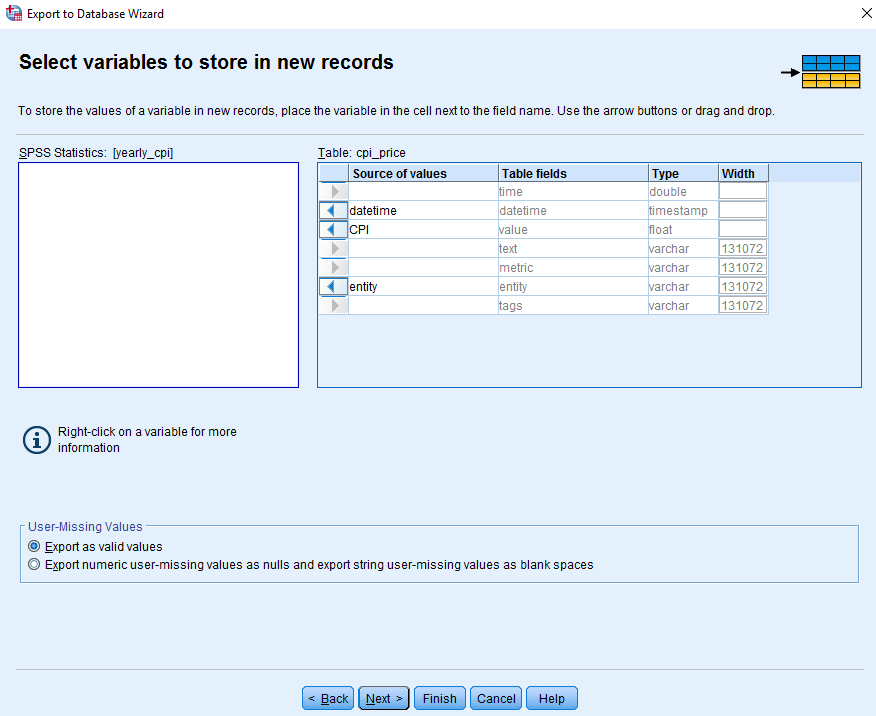
The result is as follows. Click Next
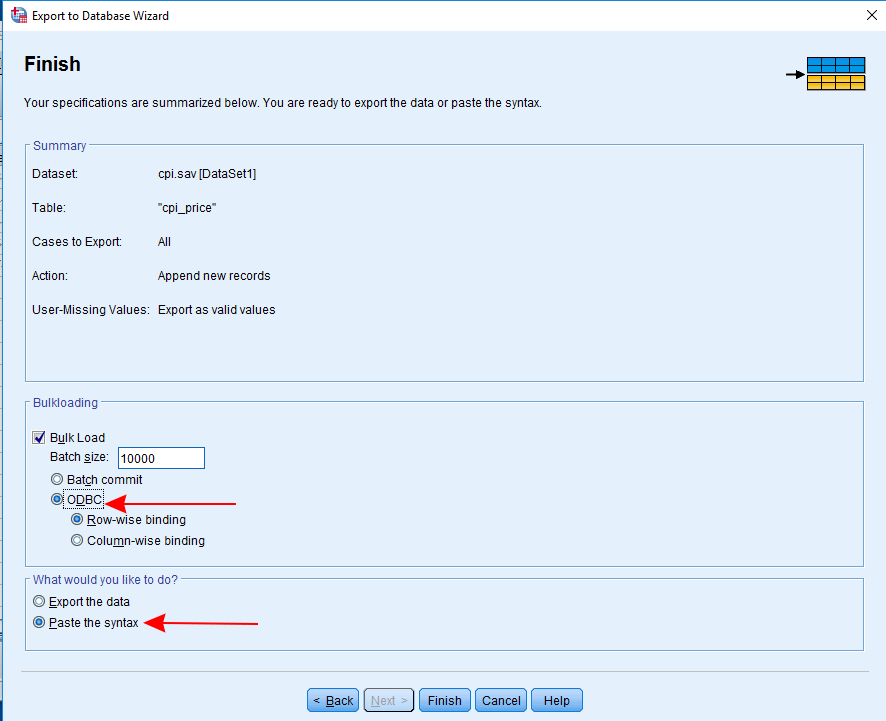
- Select ODBC > Row-wise binding, select Paste the syntax and click Finish
- Paste the following script into the dialog window:
SAVE TRANSLATE /TYPE=ODBC
  /BULKLOADING BATCHSIZE=10000 METHOD=ODBC BINDING=ROW
  /CONNECT='DSN=ATSD;'
  /ENCRYPTED
  /MISSING=IGNORE
  /TABLE='cpi_price' /APPEND
  /KEEP=datetime, value, entity.
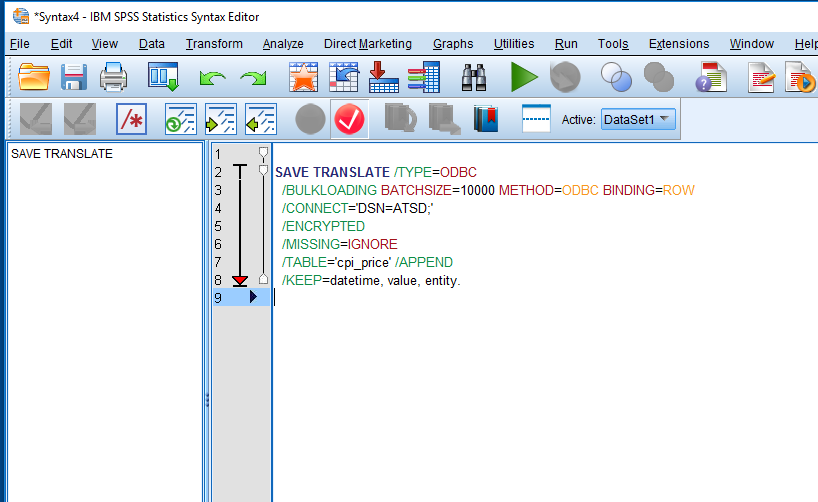
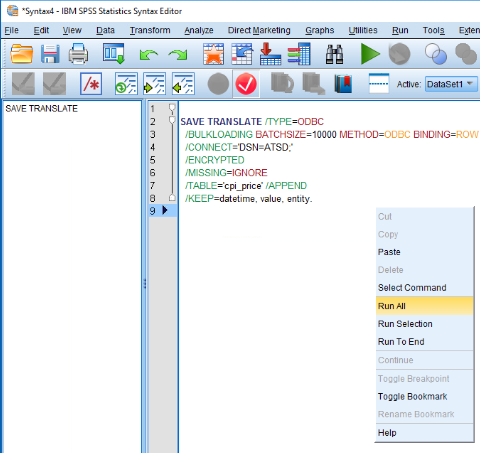
- Right-click the script window and select Run All to export the data into ATSD.
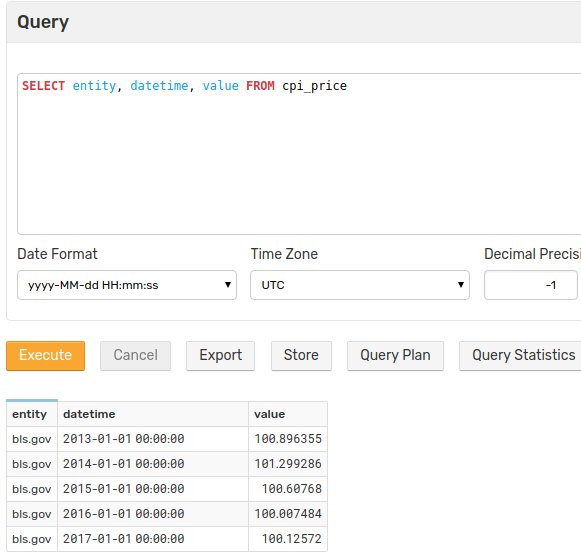
Verify Insertion
To check that data is successfully exported to ATSD, open the ATSD web interface.
- Open the SQL > SQL Console page and execute a validation query.
SELECT entity, datetime, value FROM cpi_price
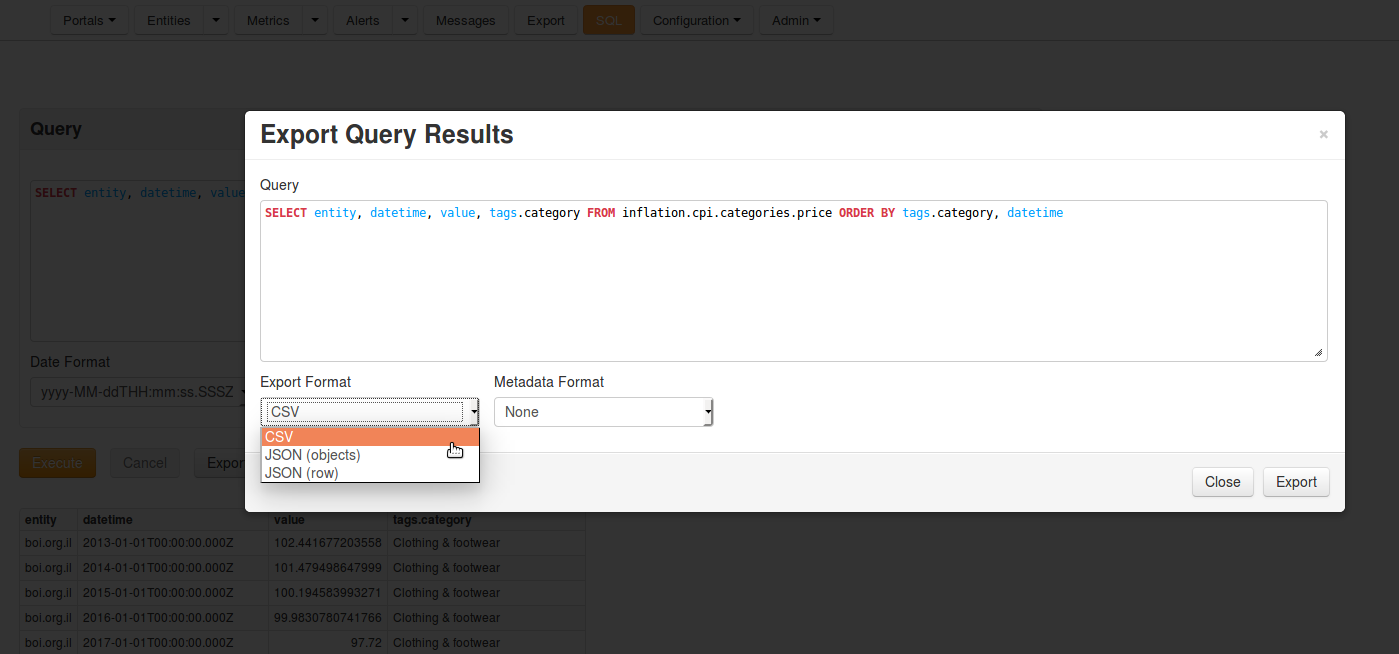
Exporting Data into CSV Files
The built-in SQL Console allows exporting query results into various data formats including Excel, CSV, and JSON, with optional metadata composed according to the W3C Model for Tabular Data.
If you do not have an ATSD installed, weights.csv and prices.csv are provided for your convenience. These files contain the output of the SQL queries listed below.
Prices
Load CPI price data.
SELECT entity, datetime, value, tags.category
  FROM inflation.cpi.categories.price
ORDER BY tags.category, datetime
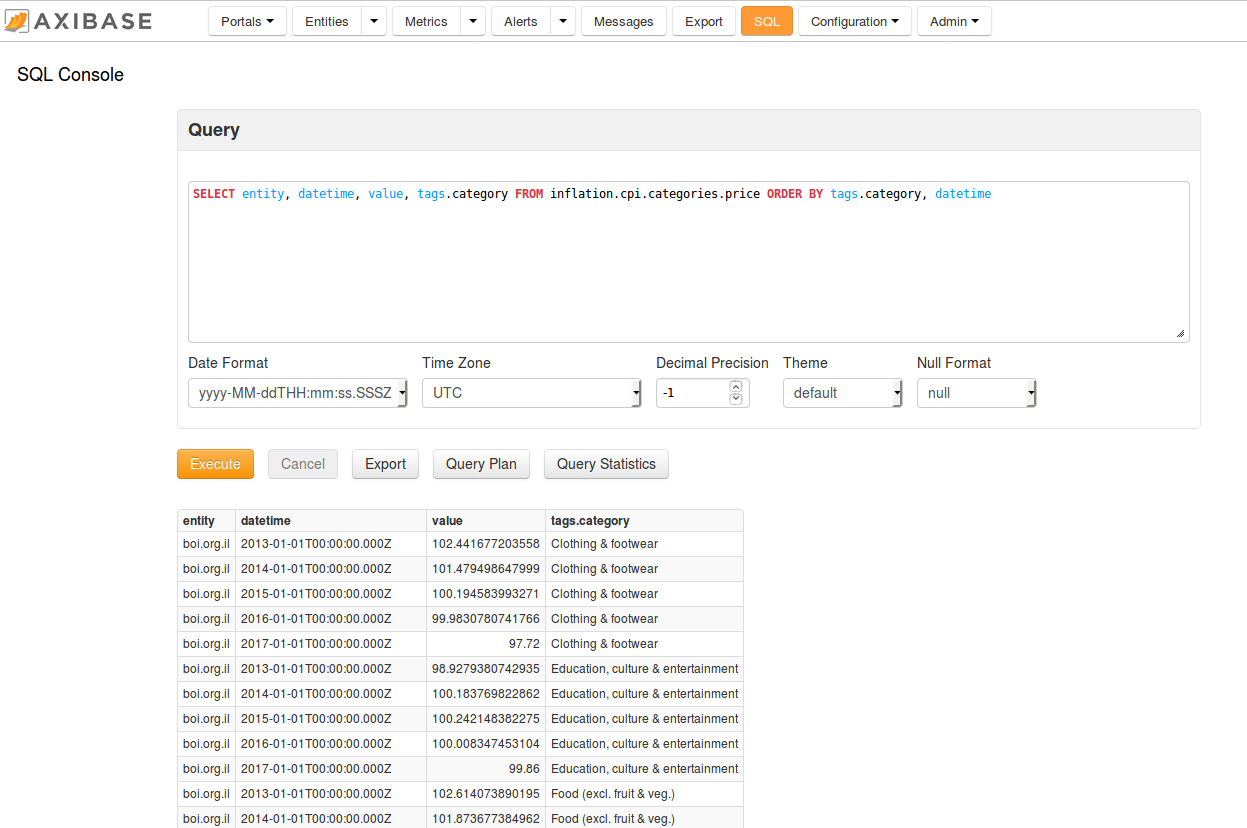
Export query results into prices.csv.
Weights
Load weight records.
SELECT entity, datetime, value, tags.category
  FROM inflation.cpi.categories.weight
ORDER BY tags.category, datetime
Export query results into weights.csv.