SPSS Modeler
Overview
The IBM SPSS Modeler provides a set of tools to build data transformations and analysis models for users without programming experience. The following guide includes examples of loading time series data from ATSD, calculating derived time series in the IBM SPSS Modeler interface and storing the results back in ATSD.
Sample Dataset
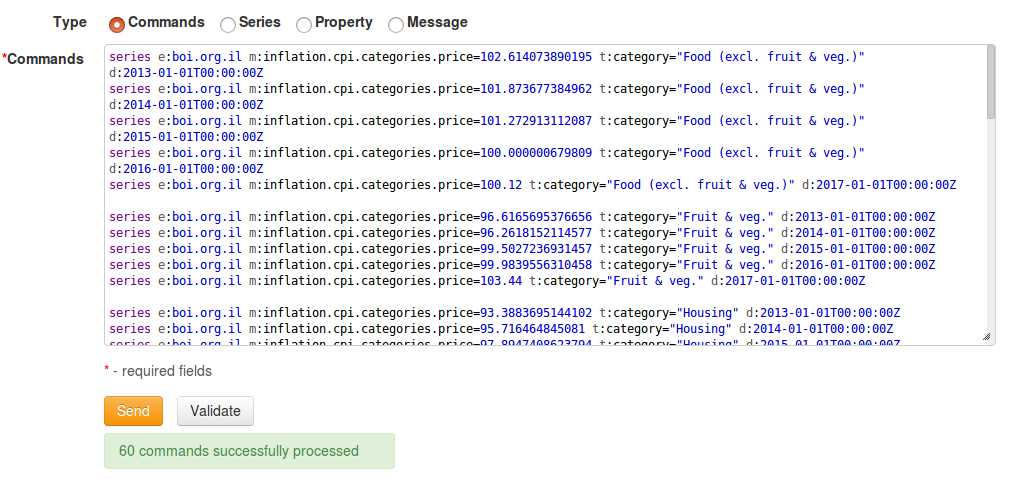
Download sample series commands.
The series contain the Consumer Price Index (CPI) for each category
of items in a consumer basket as well as a weight for each category in the CPI
basket. The weights are stored as fractions of 1000. The CPI is tracked from 2013 to
2017 and uses Year 2016 values as the baseline. Weight values are available only for
year 2017.
To load the data into ATSD, log in to the database web interface and submit these commands on the Metrics > Data Entry page.
Prerequisites
- Install IBM SPSS Modeler, version 18
- Install ODBC-JDBC bridge.
Create Data Source
Create a new stream. A stream is a configuration that records the steps to load and analyze the data in the SPSS Modeler.
Open the Sources tab from the bottom panel and choose Database
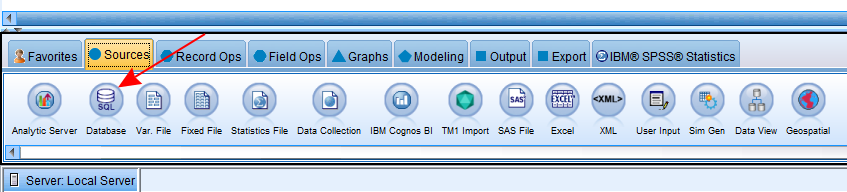
Add the Database source to the stream by dragging-and-dropping it into the stream workspace.

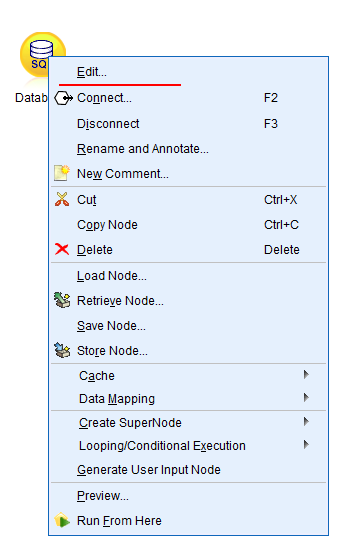
Right-click the source and click Edit...
Expand the Data source menu and choose Add new database connection
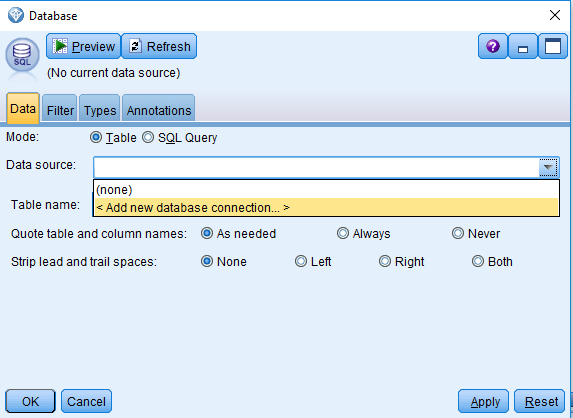
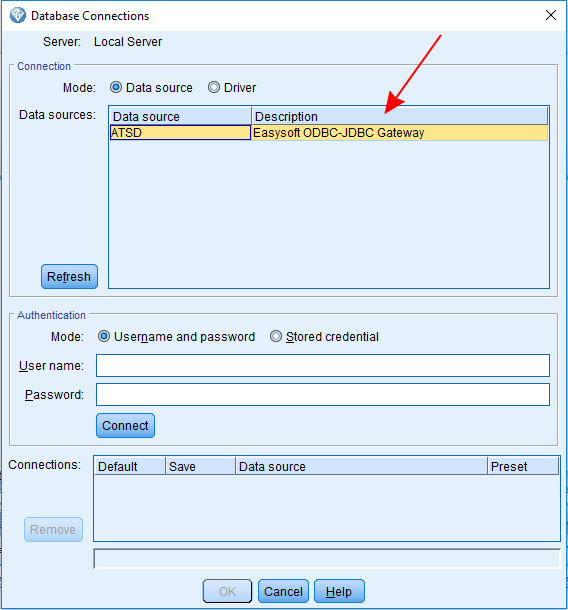
Choose ATSD ODBC as the data source. If there are no data sources visible, create an ODBC-bridged connection to ATSD as described here and click Refresh
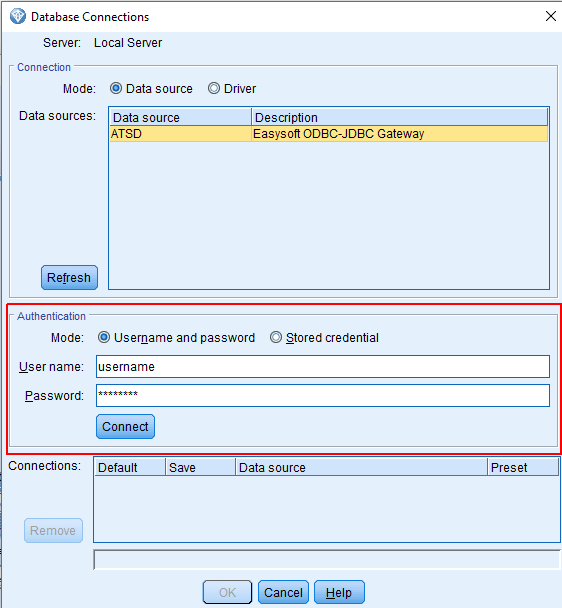
Enter your username and password and click Connect
The connection is now visible in the Connections table
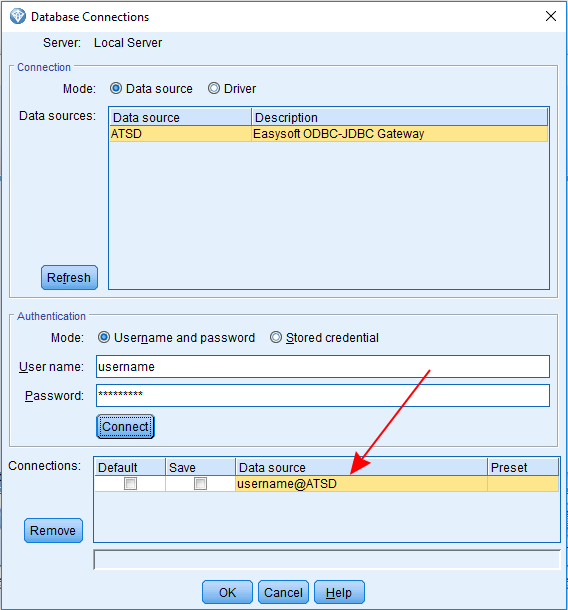
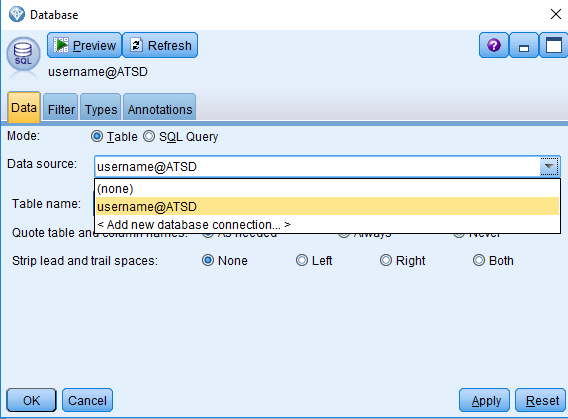
Click OK. Select the newly created ATSD data source.
Click Select... to view the list of available ATSD tables. The list of tables is based on the
tables=property specified in the JDBC URL. If you do not see the given table in the list, update ODBC data source as described here, delete your connection in SPSS Modeler and create it again. Specifytables=%to view all tables in ATSD.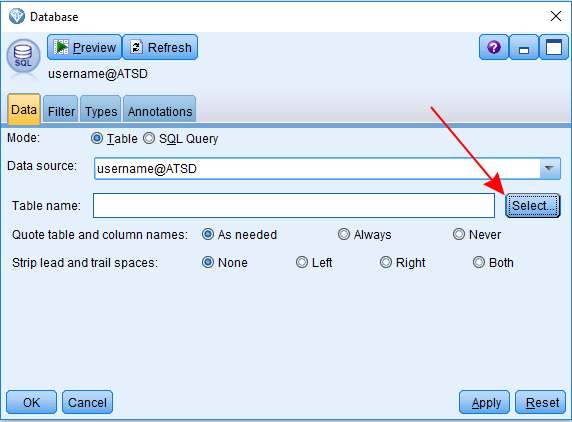
Clear the Show table owner box shown below, select
inflation.cpi.categories.pricetable and click OK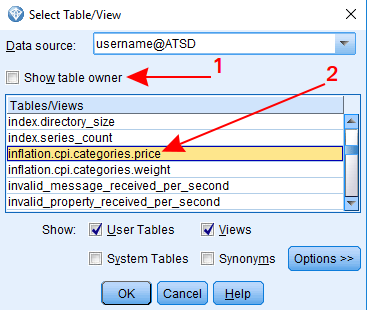
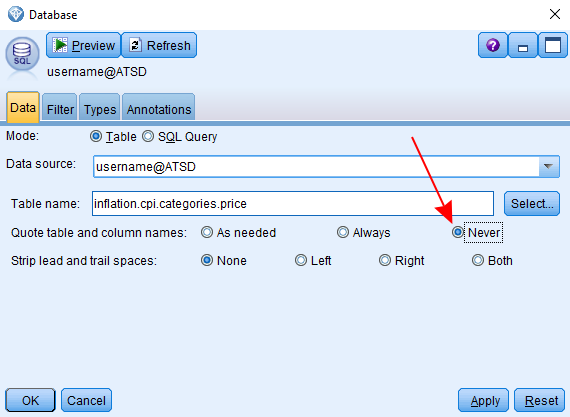
Check Never in Quote table and column names
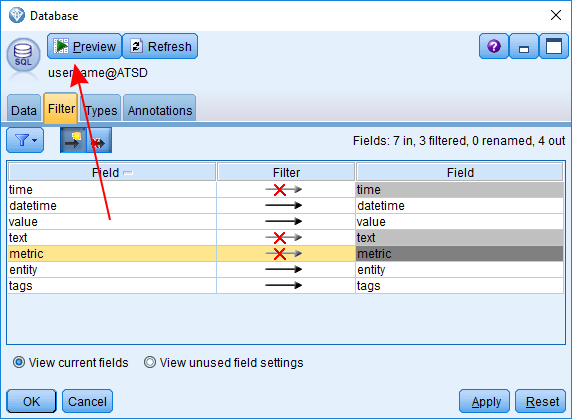
Open the Filter tab and click the arrows in the Filter column to disable the
time,textandmetriccolumns.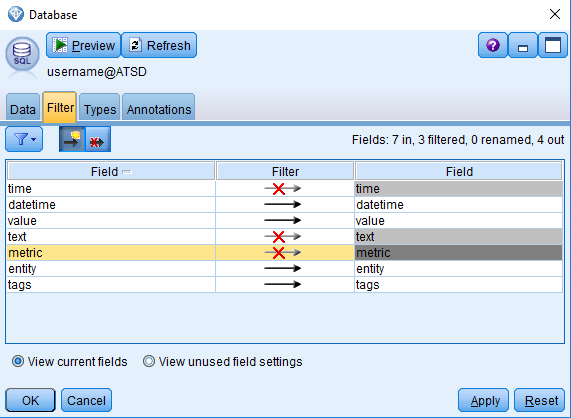
Database source setup is finished. Click Preview to verify the results by reviewing the first 10 rows in the table.
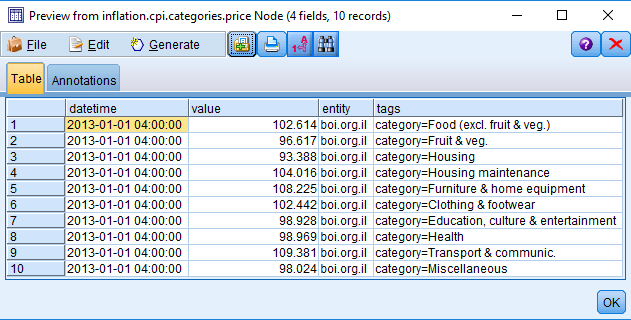
Close the preview table and click OK in database source settings window to save changes.
Repeat these steps to create another data source for table
inflation.cpi.categories.weight
Join Tables
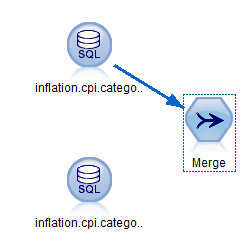
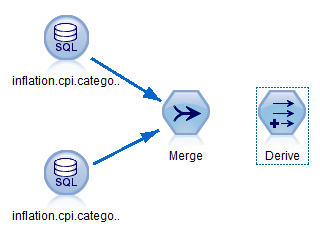
Open the Record Ops tab in the bottom panel, choose the Merge node and add it to the stream
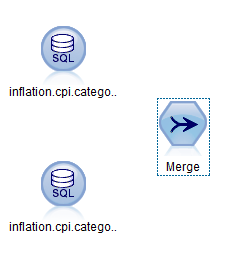
Right-click one of the database source shapes and select Connect...
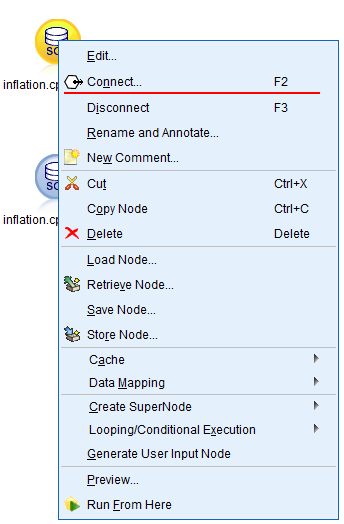
Select the Merge shape. A link appears between the source and the Merge shapes.
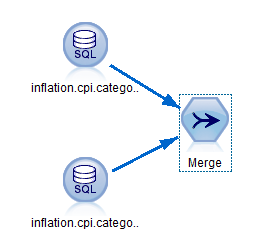
Connect the other source with the Merge shape using the same technique.
Right-click the Merge shape and select Edit.... Set Merge method to Keys and add the
tagsfield to Keys for merge field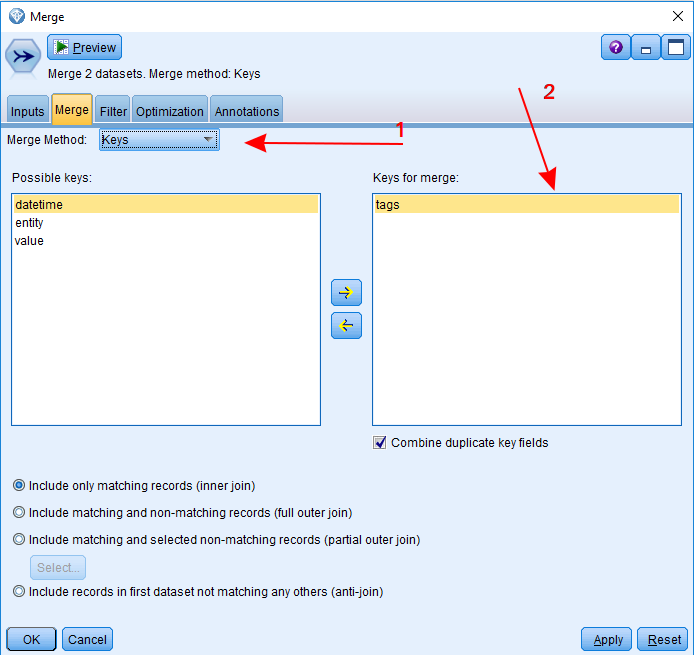
Open the Filter tab and disable
entityanddatetimefields for theinflation.cpi.categories.weighttable.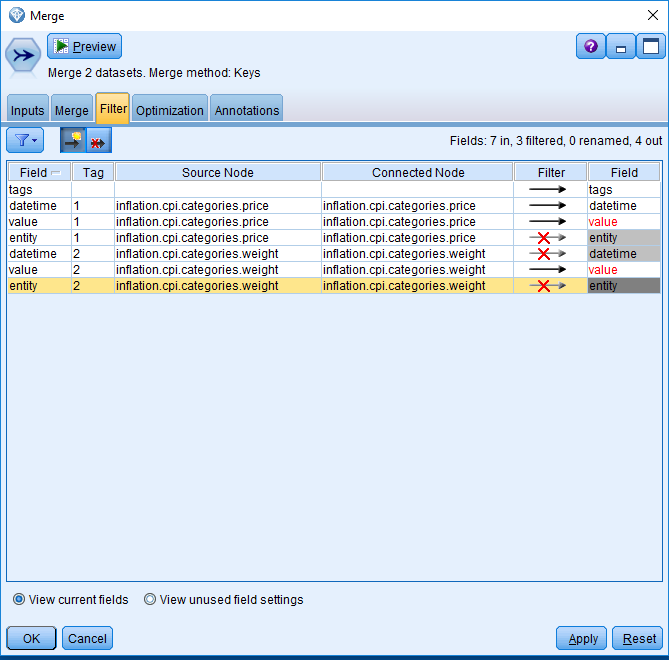
Rename the
valuefield in theinflation.cpi.categories.pricetable topriceand thevaluefield ininflation.cpi.categories.weighttoweight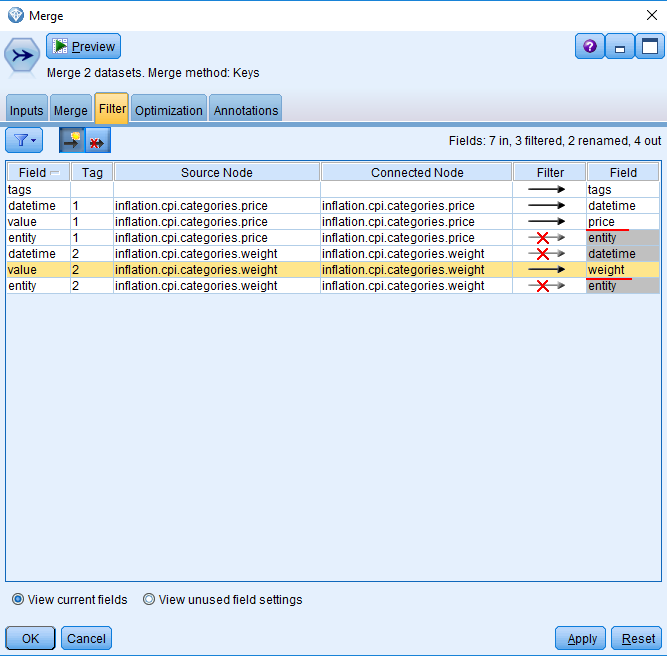
Click Preview to check the results
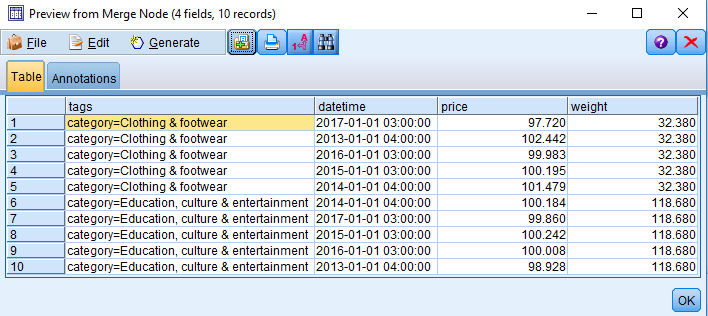
Close the Preview window and click Ok to save changes.
Calculate Weighted Price
Open the Field Ops tab in the bottom panel, choose the Derive shape and add it to the stream.
Connect the Merge and Derive shapes
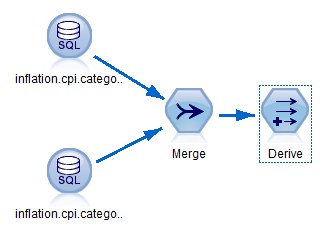
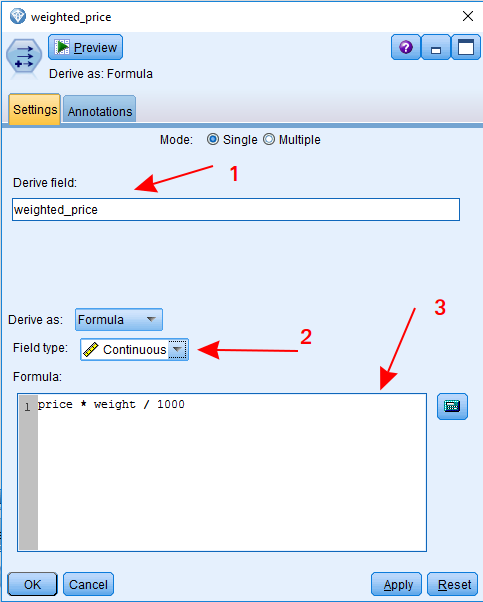
Right-click the Derive shape and select Edit...
- Set Derive field to weighted_price
- Set field type to Continuous
- Add the formula price * weight / 1000
Click Preview to check results. The weighted_price column is displayed.
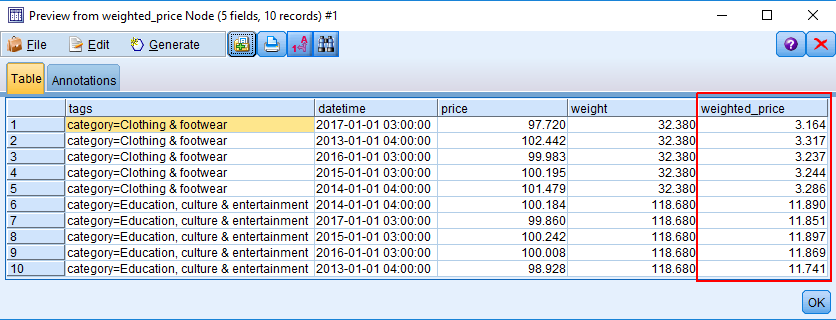
Close the Preview window and click Ok to save changes.
Calculate Weighted Inflation per Year
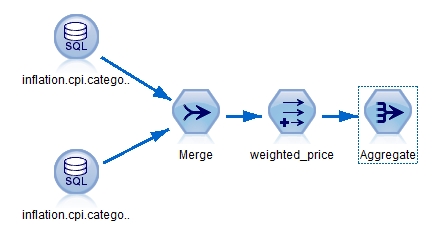
Open the Record Ops tab, choose the Aggregate shape and add it to the stream.
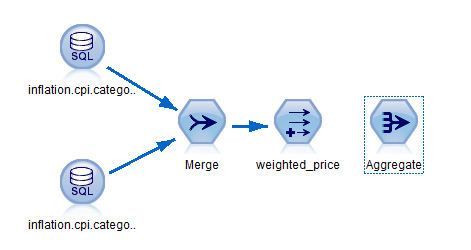
Connect the Derive (weighted_price) and Aggregate shapes
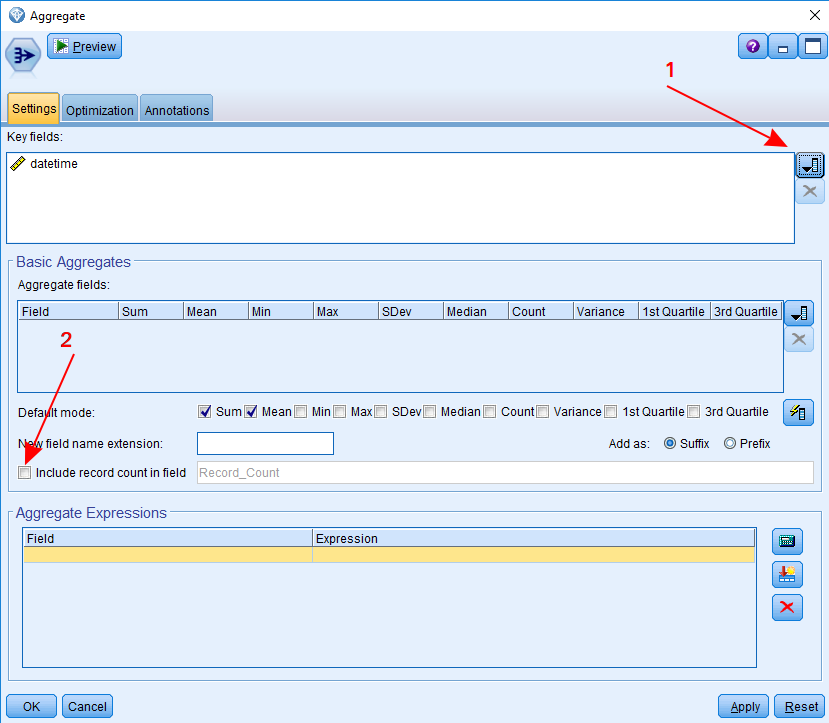
Right-click the Aggregate shape and select Edit...
- Add
datetimein Key fields - Clear the Include record count in field box.
- Add
In the Aggregate expressions table, enter the field name
valueand click Launch expression builder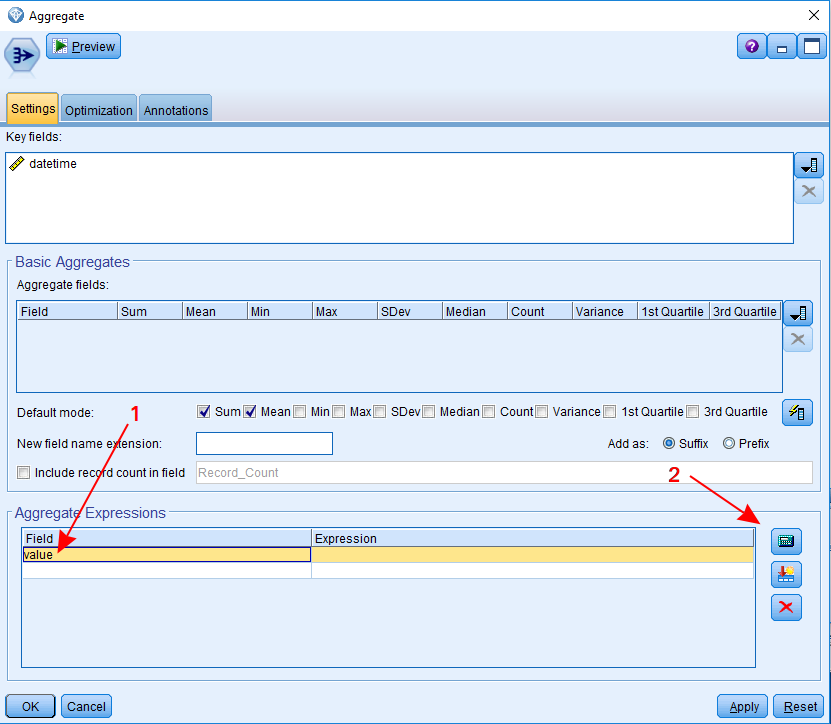
In the Expression Builder window, enter the formula
SUM('weighted_price')and click OK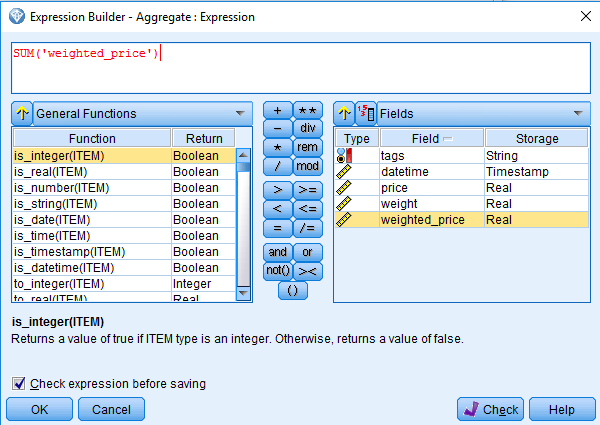
Click Preview to check the results
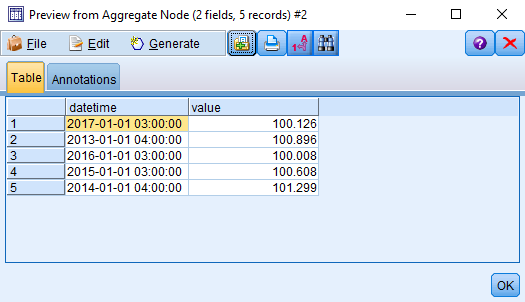
Close the preview table and click OK to save the changes.
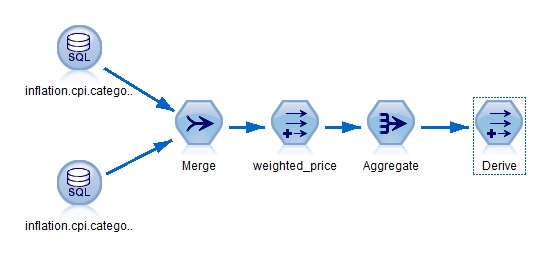
Add Entity Field
Open the Field Ops tab, choose the Derive shape and add it to the stream
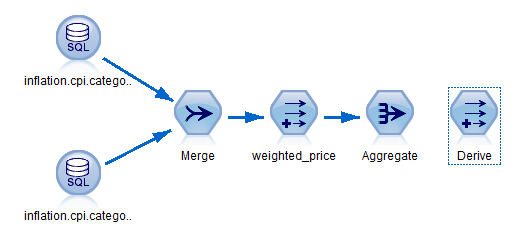
Connect the Aggregate and Derive shapes
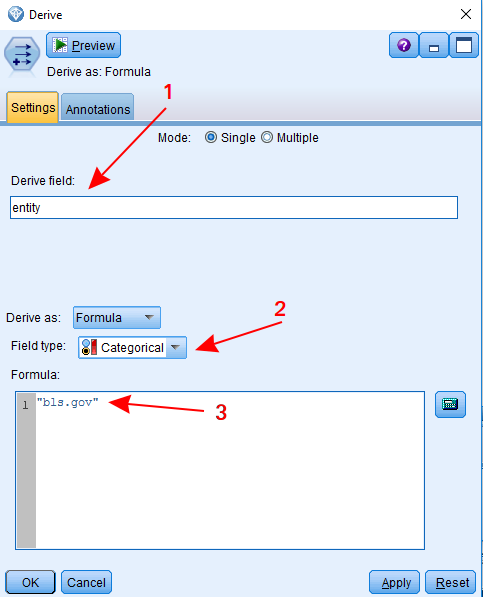
Right-click the Derive shape and click Edit...
- Set the Derive field to entity
- Set field type to Categorical
- Add formula "bls.gov"
Click Preview to check the results with the entity column added.
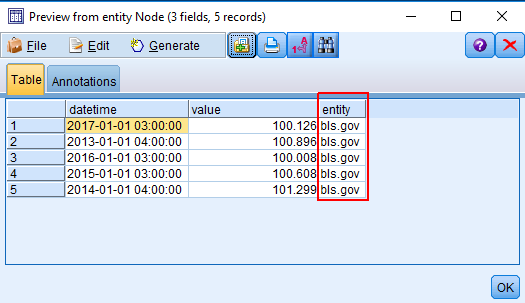
Close the preview table and click OK to save changes.
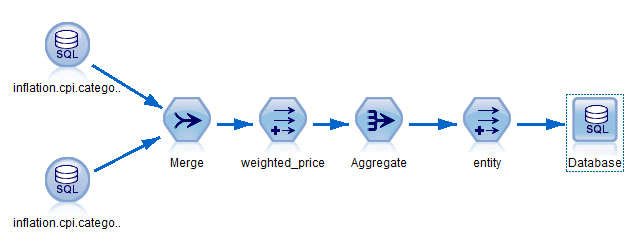
Export Results
Open the Export tab, choose the Database shape and add it to the stream
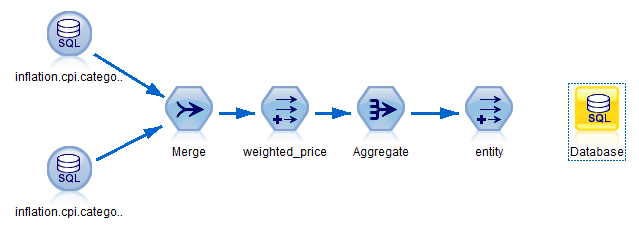
Connect the Derive (entity) and Database shapes
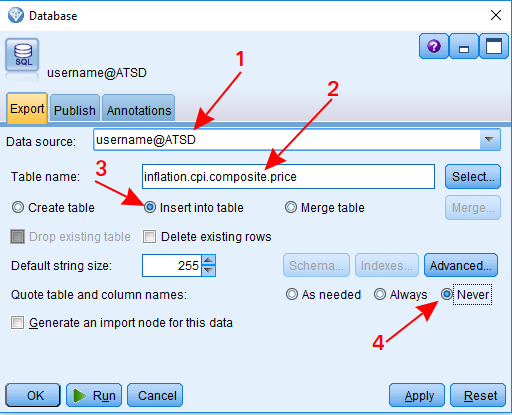
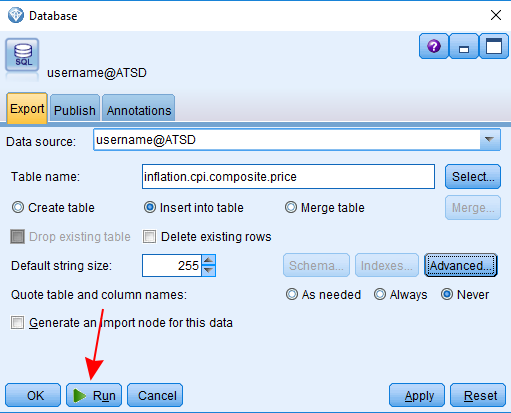
Right-click the Database shape and select Edit....
- Choose Data source.
- Type
inflation.cpi.composite.pricein Table name. This is the name of the new metric inserted into ATSD. - Select Insert into table.
- Set Quote table and column names to Never.
Click Advanced....
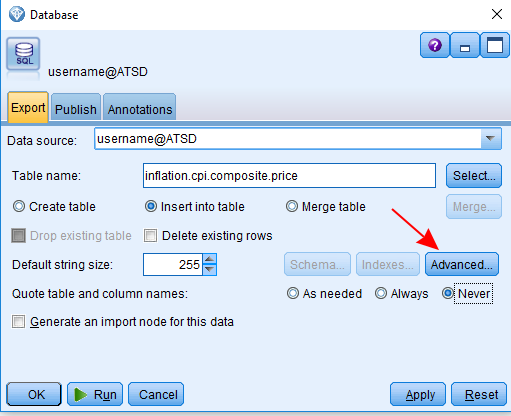
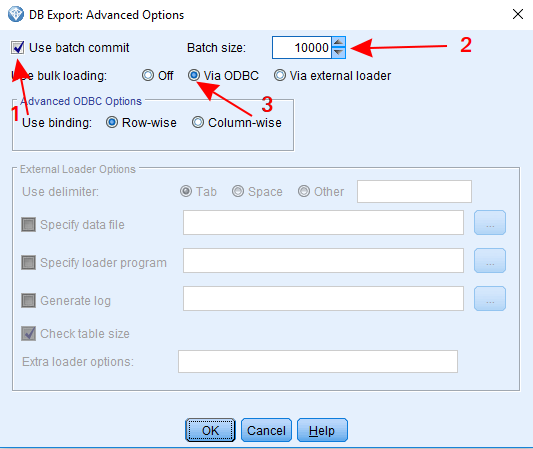
In the Advanced Options window
- Check Use batch commit
- Set batch size large enough to load all your export data in a single batch
- Set Use bulk loading to Via ODBC
- Click OK to save and exit.
Click Run to export data into ATSD
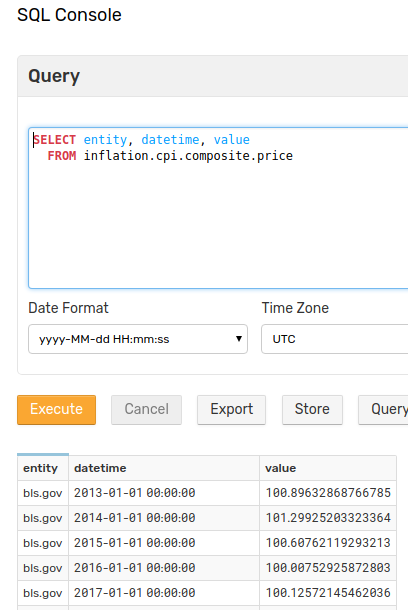
Verify Insertion
To check that data is successfully exported to ATSD, open the ATSD web interface, open the SQL > SQL Console page and execute the following query:
SELECT entity, datetime, value
  FROM inflation.cpi.composite.price
Stream File
Download the stream file used for this guide for review in your own IBM SPSS Modeler installation.