Alteryx Designer
Overview
Alteryx Designer is a graphical design environment to create and edit ETL (Extract, Transform, Load) workflows. The following guide includes examples of loading time series data from ATSD, calculating derived time series in Alteryx and storing the results back in ATSD.
Sample Dataset
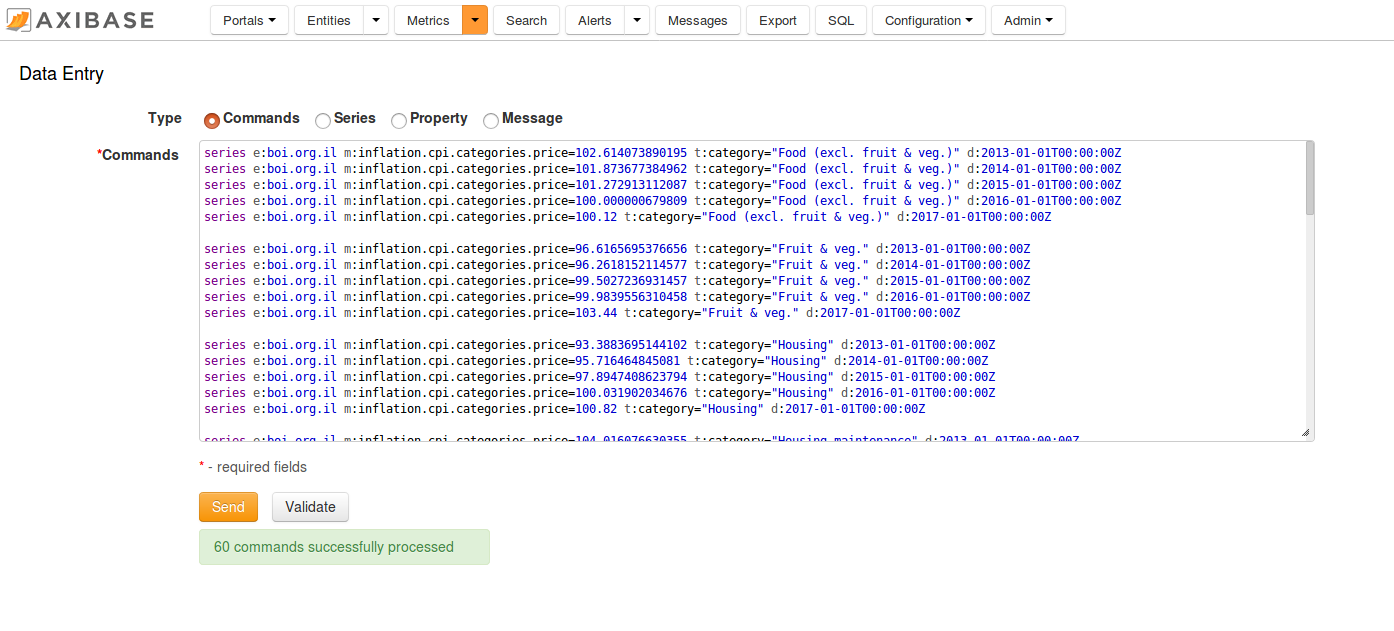
For the purpose of instruction, we use sample series commands.
The series contain the Consumer Price Index (CPI) for each category
of items in a consumer basket as well as a weight for each category in the CPI
basket. The weights are stored as fractions of 1000. The CPI is tracked from 2013 to
2017 and uses Year 2016 values as the baseline. Weight values are available only for
year 2017.
To load the data into ATSD, log in to the database web interface and submit these commands on the Metrics > Data Entry page.
Prerequisites
- Install Alteryx Designer, version 11.x.
- Install ODBC-JDBC gateway.
Create Database Connection
Create a new Alteryx Designer workflow.
Add the Input Data tool to your workflow.
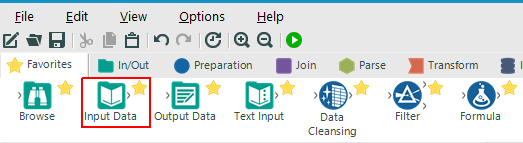
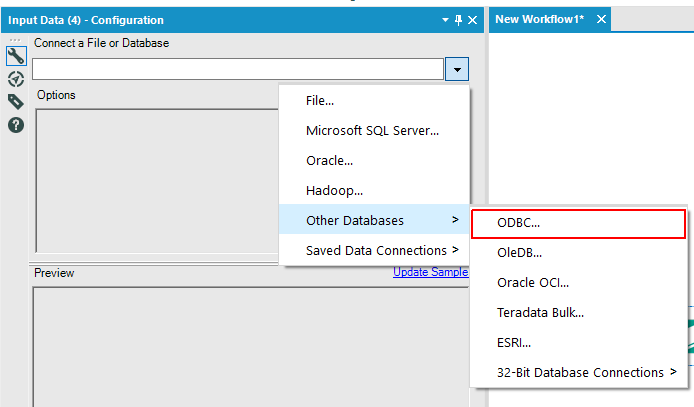
Choose Other Databases > ODBC... in the Input Data configuration window.
Open the ODBC Connection dialog.

Open the ODBC Data Source Administrator window by pressing the ODBC Admin button in the ODBC Connection dialog.
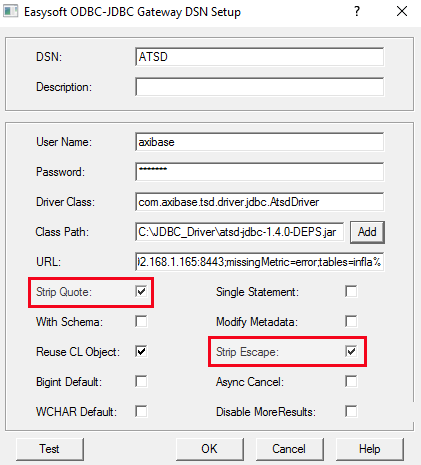
Configure the data source.
Add the
missingMetric=errorproperty to the DSN URL to ensure that the driver functions properly.
jdbc:atsd://atsd_hostname:8443;missingMetric=error
- If the target ATSD installation contains more than 10000 metrics, consider adding the
tablesproperty to the DSN URL to filter metrics by name in the Query Builder. For example,tables=infla%shows only metrics that begin withinfla.
jdbc:atsd://atsd_hostname:8443;missingMetric=error;tables=infla%
Refer to the JDBC driver documentation for additional details.
Check (enable) the Strip Quote and Strip Escape options, click OK.
Select the name specified for DSN during bridge configuration from the Data Source Name list, click OK.

Building Queries
After creating a connection, open the Choose Table or Specify Query dialog.
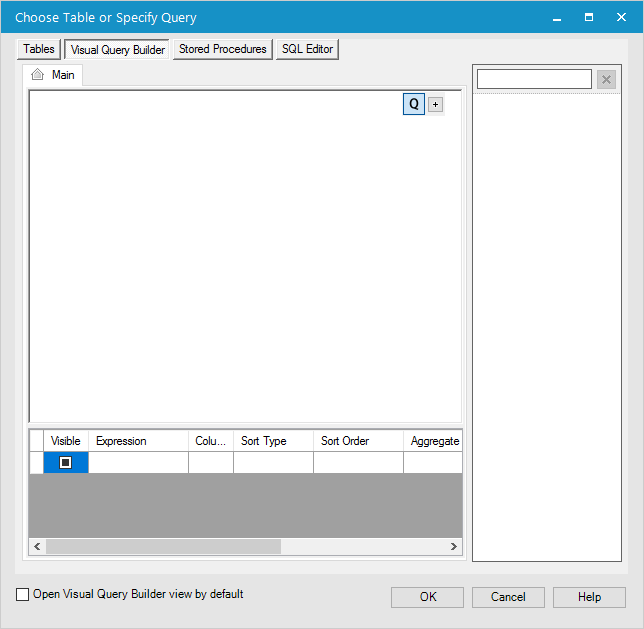
This allows you build a query by choosing a table or entering query text manually.
Table names visible on the Tables tab satisfy the
tablespattern specified in the DSN URL. Click Refresh to reload the list, if necessary.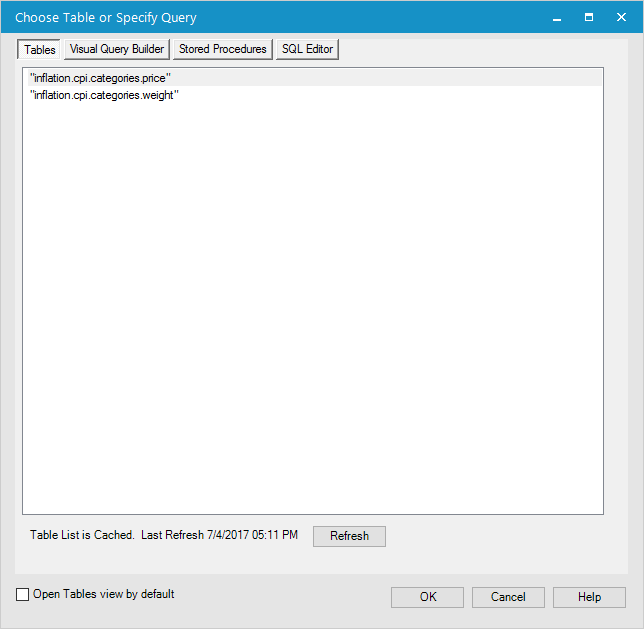
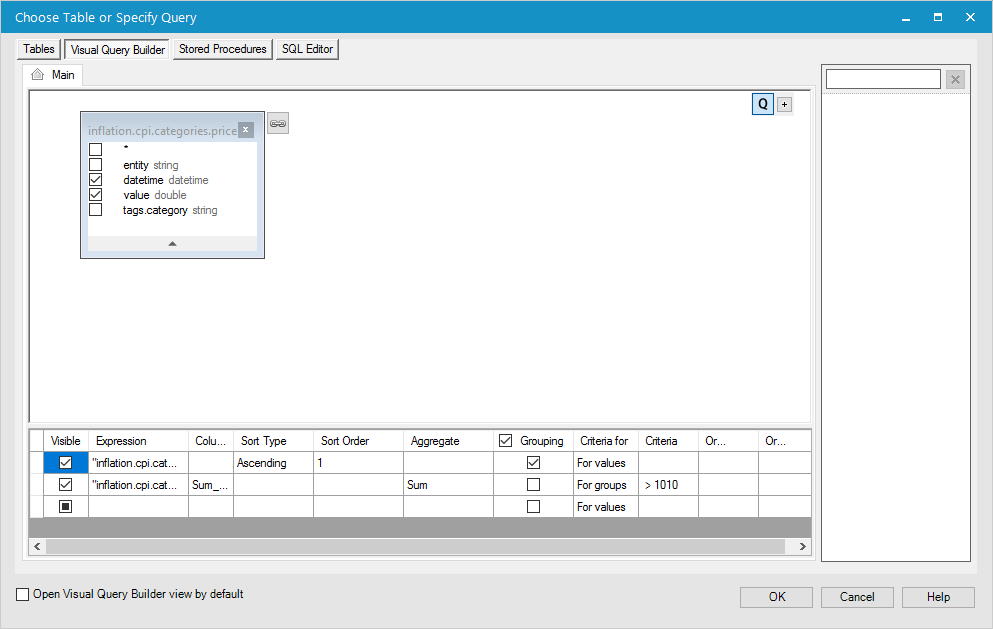
In the Visual Query Tab, you can specify particular columns in the
SELECTexpression as well as add optional sorting and grouping to prepare your data before processing it in the workflow. Below is an SQL query and corresponding configuration.
SELECT datetime, sum(value) AS sum_value
  FROM inflation.cpi.categories.price
GROUP BY datetime
  HAVING sum_value > 1010
ORDER BY datetime
The SQL Editor allows you to review and modify pre-built queries or write your own.
The Test Query button truncates the query after the
FROMclause and sends only the remainingSELECT ... FROM ...expression to the database for validation.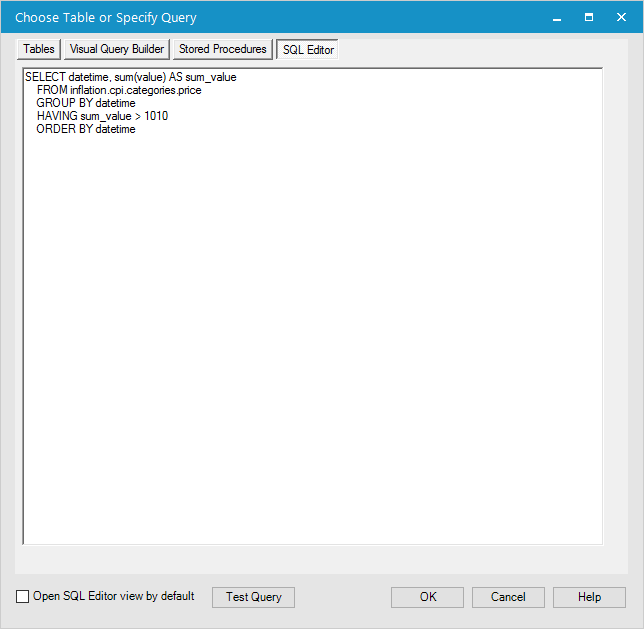
Click OK when the query is ready for processing.
Check Query Results
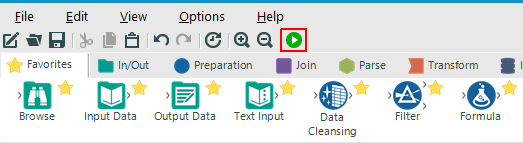
Click Run Workflow, to see the result of the query.

Calculate and Store Derived Series
This section describes how to create a workflow that retrieves existing data from ATSD to produce new series in Designer and then store these series back in ATSD. To calculate a weighted inflation index, we multiply the CPI of each category by its weight divided by 1000 and sum the products.
The resulting workflow is implemented as follows:
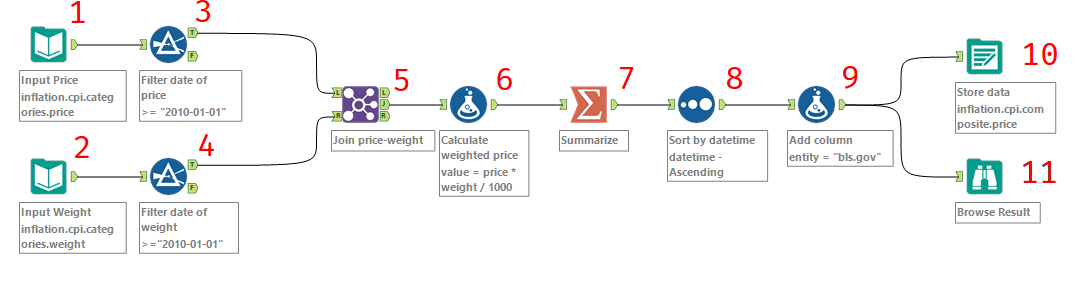
You can download this workflow for review in your own Alteryx Designer installation.
The workflow consists of these steps (nodes):
Input Data tool. Repeat the steps in the Create Database Connection section for this tool, choose
inflation.cpi.categories.pricetable. Selectdatetime,valuecolumns and manually addtags.categoryas shown below.
Input Data tool. Follow the same procedure as above for the
inflation.cpi.categories.weighttable.Filter tool. Specify the condition
>= January 1st, 2010and use the T (true) node output to retrieve the series created after 2009 only.

Filter tool. Follow the same procedure as above.
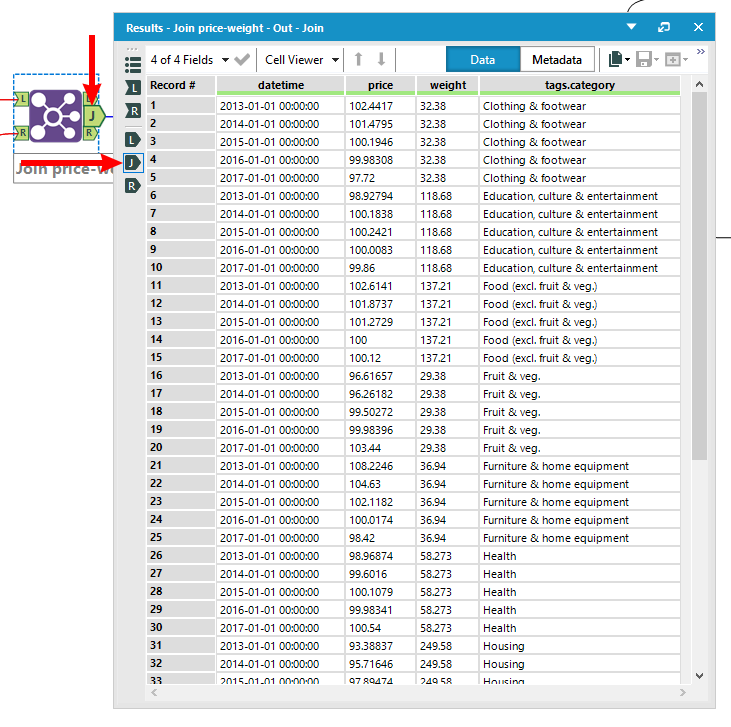
Join tool. Join prices and weights by
tags.categoryfield. Clear fields as shown on the image. Renamevaluefields forinflation.cpi.categories.priceandinflation.cpi.categories.weighttopriceandweightrespectively,inflation.cpi.categories.price.datetimetodatetimeandinflation.cpi.categories.price.tags.categorytotags.category.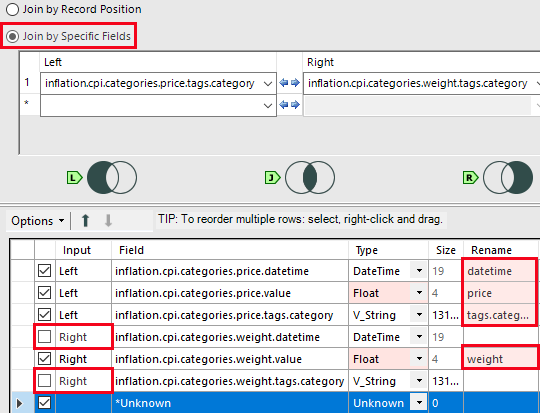
Note
To check input or output of any node, run the workflow and click its input/output.
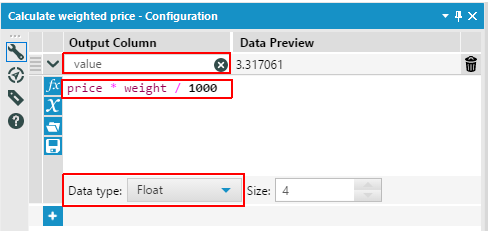
Formula tool. Connect its input to the J (inner join) output of the Join node. Next, create a new column named
valueto store the result. Fill in the expression to calculate it, and specify the correct data type.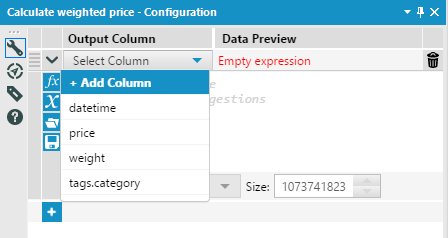
Summarize tool. Select fields from above to get the actions list as shown below on the image. Input
valueinto Output Field Name.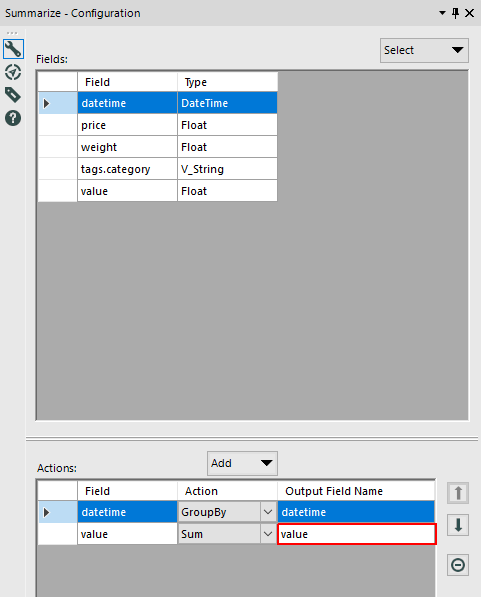
Sort tool. Apply it to sort records by date.

Formula tool. Create a new column named
entitywith the Formula tool. Name it"bls.gov.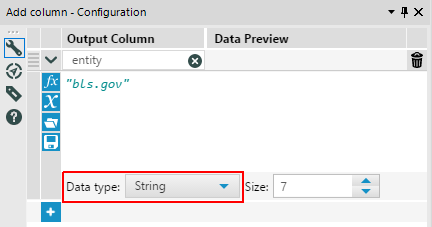
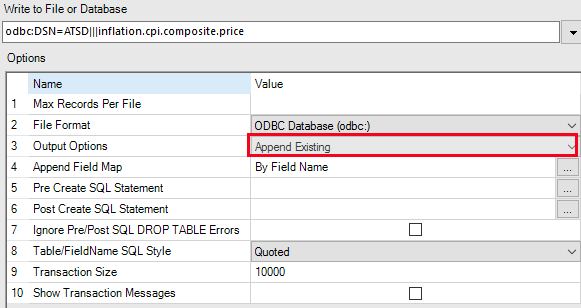
Output Data tool. Choose ODBC Connection as before and enter a name for the new metric, in this case
inflation.cpi.composite.price. Edit Output Options in the configuration dialog.
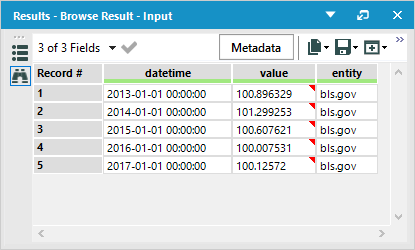
Browse tool. View the final result.
Click Run Workflow.
The data is retrieved from the database and processed in Designer by the workflow with the new series stored back in the database.
Click Browse to view the results.