Creating Rules: Basic Workflow
Overview
The article outlines steps involved in creating a basic email alert using ATSD rule engine.
Find Series
Open the Metrics tab and search for a metric of interest. Enter the full metric name or a partial name containing a * wildcard.
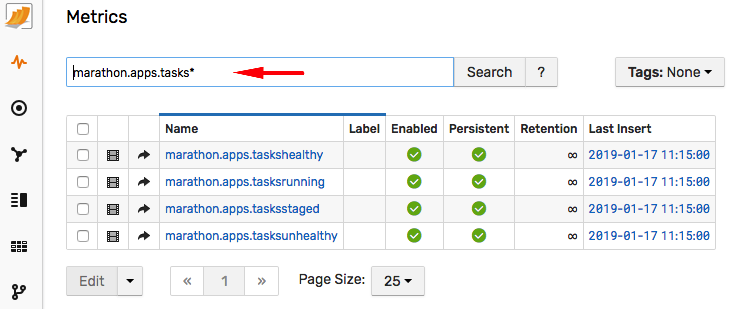
The search input supports various options for finding the metrics and customizing the results. For more examples click the help link.

If the metric is present in results, check that its Last Insert date is close to current time which means that the metric is being actively collected.
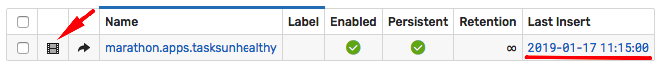
Click the Series icon to view specific time series collected for this metric.
Each time series is unique and is identified by the metric name, the entity name and an optional set of tags describing the series. This is called 'series key' in ATSD schema.
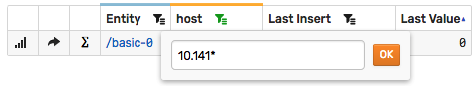
The list of series for the given metric can contain thousands of individual series which can be filtered by applying a condition for one or multiple columns.
The entity and tag columns can be filtered by partial text match.
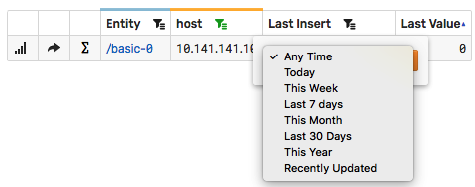
The Last Insert column allows limiting the results to recently updated series.
Locate a series that is a good candidate for testing alerts. Typically such series contains measurements that would have caused alerts in the past. For example, when creating a rule that alerts if the value exceeds 50, search for series that crossed this threshold during the last day or week.
In the absence of obvious candidates, identify such series by opening the SQL Console and searching for series using an SQL query.
SELECT entity, tags, max(datetime), max(value)
  FROM atsd_series
  -- replace <metric-name> with actual value
WHERE metric = '<metric-name>'
  AND datetime > NOW - 7*DAY
  -- replace 50 with threshold value
  AND value > 50
GROUP BY entity, tags
ORDER BY max(datetime) DESC
  LIMIT 10
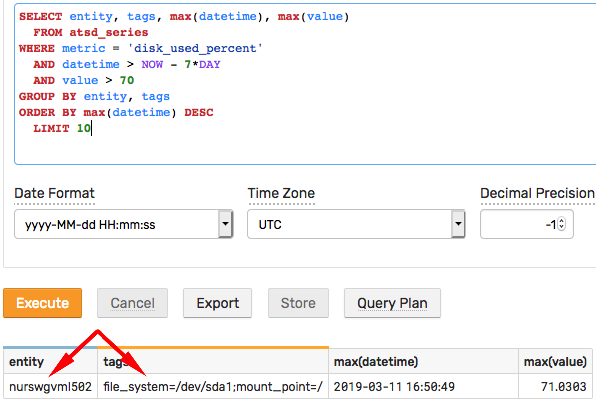
For more information, review ATSD SQL documentation.
Alternatively, create a portal with conditional series visibility which displays only series that crossed the threshold.
[widget]
  type = table
  # change type to view the series on the time chart
  # type = chart
  timespan = 1 day
  multiple-series = true
  display = max('1 day') > 50
  # use 'enabled' setting instead of 'display' to keep series in the chart legend
  # enabled = max('1 day') > 50

  [series]
    metric = <metric-name>
    entity = *
For more information about ATSD graphics, review the portal and charts documentation.
View Series
Once the series is located, click the ∑ icon to open the Series Statistics page. This page analyzes the series and presents summary information about the observed values.
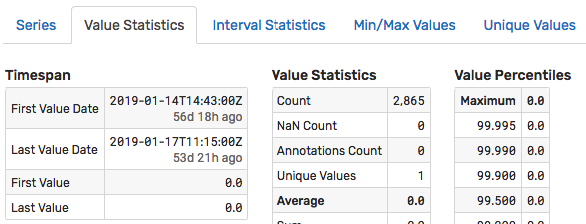
The interval of time for analyzing the measurements can be adjusted using the Start Date and End Date controls located above the tabs.
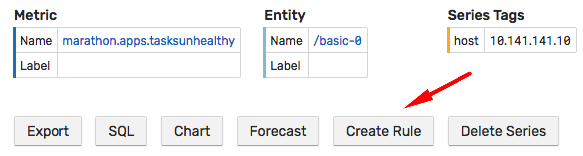
Click Create Rule to open the rule editor.
The list of current rules is also accessible from the top menu under the Alerts > Rules link.
Create Rule
Open the Overview tab and customize the rule name. It is recommended that you establish a naming convention to easily categorize and filter rules by name.
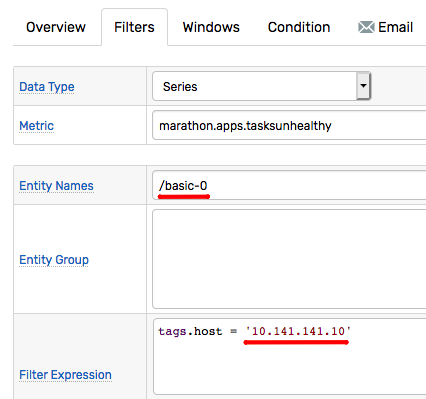
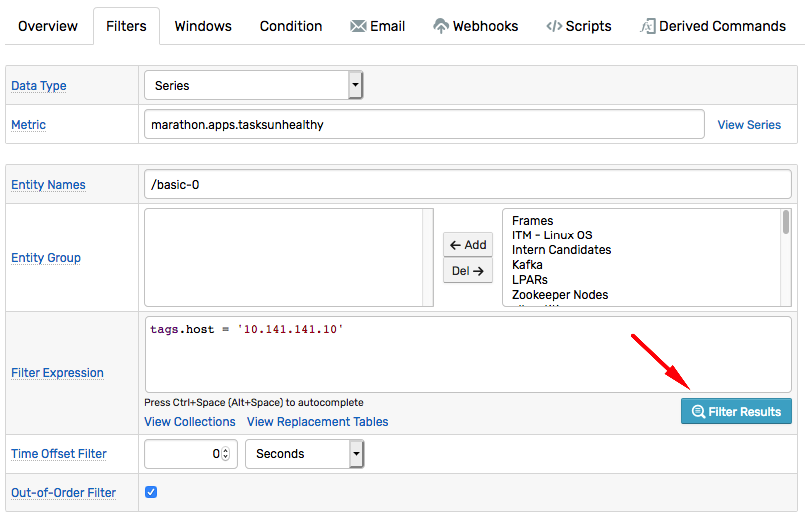
Click the Filters tab. The tab is automatically pre-filled with the entity name and tag values for the selected series. This filter can be relaxed at a later stage to accept more than one series.
Open the Windows tab and set Window Size to count = 1.
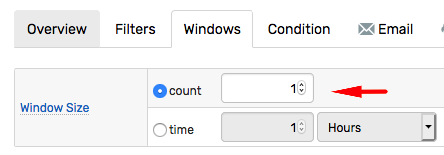
A count-based window accumulates up to the specified number of samples, and a window of size 1 consists of only one sample.
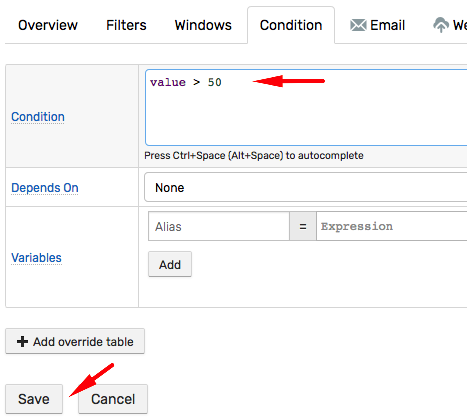
Open the Condition tab and modify the pre-filled boolean expression that creates an alert when it evaluates to true.
The example below is true when the received value is above the threshold of 50, and it reverts back to false when the value is equal or less than 50.
value > 50
Because count-based windows of size 1 contain only one sample, statistical functions such as average or maximum are not useful in this context since they operate on a single value and as such return the value itself.
Click Save to save the rule.
Test Rule
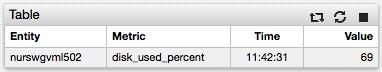
Test on Incoming Data
To test the rule on incoming data you can temporarily adjust the condition by lowering the threshold value.
value > 10
Save the rule and click the View Windows link on the Windows tab.
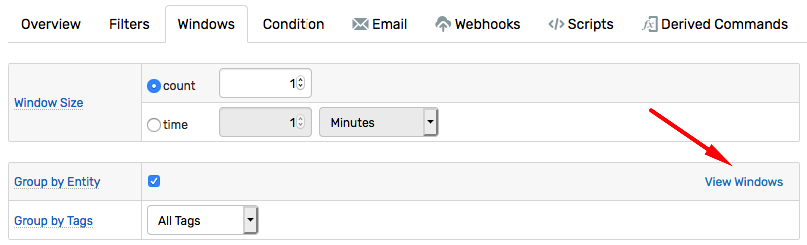
The window list contains all active windows for the series that received at least one sample after the rule is saved. If the metric is collected infrequently wait until a few samples arrive and activate the windows.
The status of the window indicates whether the condition is true or false. If the condition is true, the status is OPEN or REPEAT.
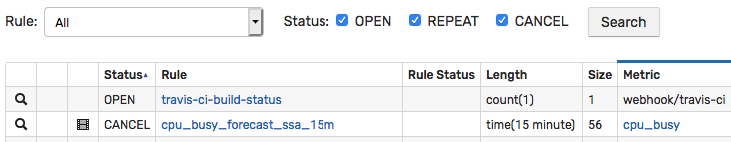
OPEN or REPEAT status mean that an alert is raised.
If the window list is empty or all windows are in CANCEL status, adjust the threshold some more. In case the windows are still missing, open the Filters tab in the rule editor and click Filter Results link to view which samples are discarded and why.
Test on Historical Data
Click the Test tab in the rule editor to back-test the rule on historical data.
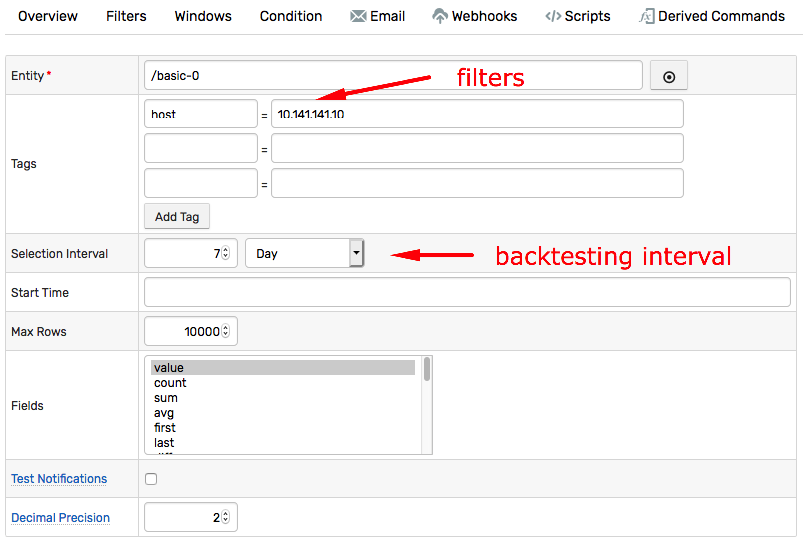
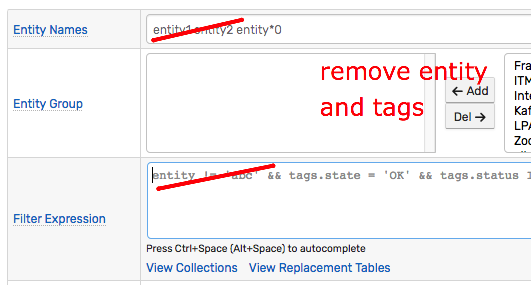
Modify the entity name and add or remove tags to filter the results to select a subset of series collected by the metric.
Adjust the Selection Interval to increase the back-testing interval.
The results contain a chronological list of window status changes based on historical data.
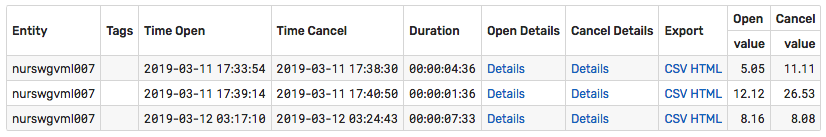
Customize the threshold and re-run the test to arrive at a configuration that captures the observed anomalies.
Click Save to save the latest changes.
Relax Filters
Once the rule is tested and verified for one specific series, the filter can be relaxed to accept data for the remaining matching series collected by the same metric.
Send Alert to Email
The rule can be configured to trigger actions of various types.
- Send email
- Trigger webhook to send alert to chat or call a web service.
- Execute script
- Generate derived metrics
- Log event to file
To deliver an email when the condition becomes true, open the rule editor and click the Email tab.
Note
Sending emails requires the ATSD Mail Client to be configured and enabled.
Create a new notification, enter one or multiple subscribers, and enable the On Open trigger.
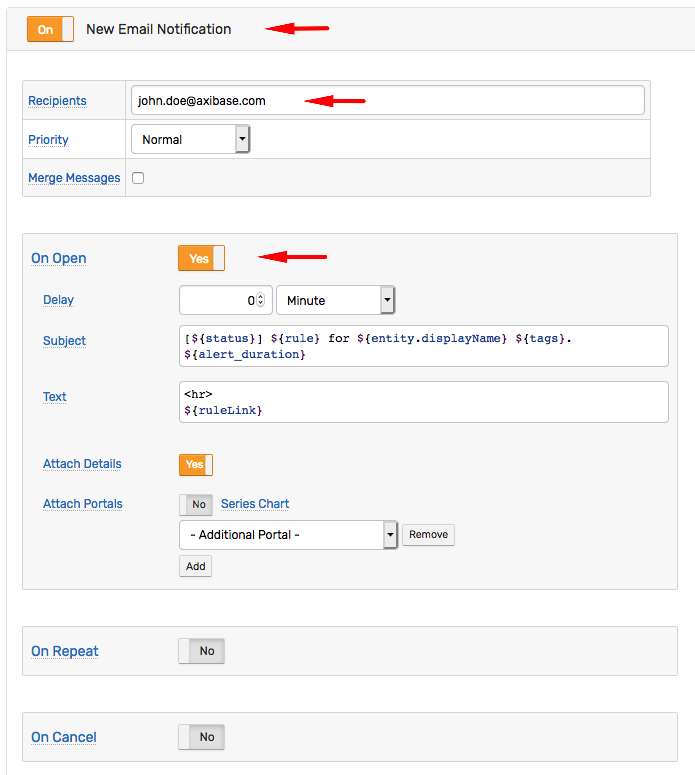
The On Open trigger delivers emails only when the window status changes from false to true. It does not deliver emails when the incoming value confirms the status. Use the On Repeat trigger if repeat notifications are required, for example to re-send the email every 2 hours.
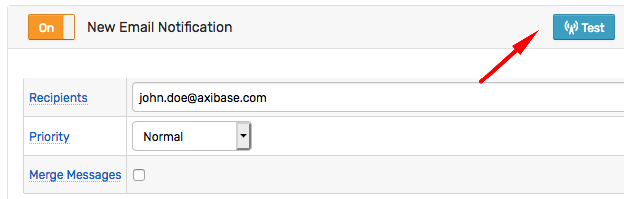
Click Test to verify email delivery.
The test attempts to find a historical record that both passes the filter and evaluates the condition to true. If such sample cannot be found, the test sends an email message assembled from a synthetic sample. Therefore the content of the email message for an actual alert is different.
Refer to email notification documentation for additional information on how to customize the message content.