Data Retention
Retention settings control database size by automatically removing old data as well as discarding unnecessary data before the records are stored on disk.
Default Retention Settings
| Data Type | Data Table Name | Retention |
|---|---|---|
| Series | atsd_d | Not deleted. |
| Properties | atsd_properties | Not deleted. |
| Messages | atsd_messages | Deleted after 1 year. |
Data Tables
Current data table sizes are displayed on the Settings > Storage > Database Tables page, in the Store File Size column.
The table which stores time series data is atsd_d.
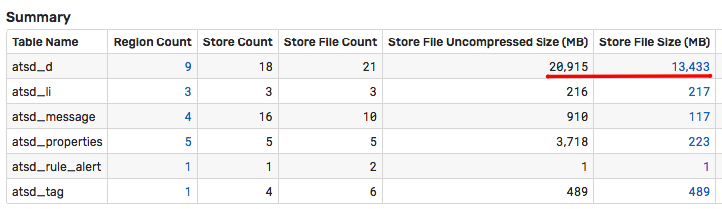
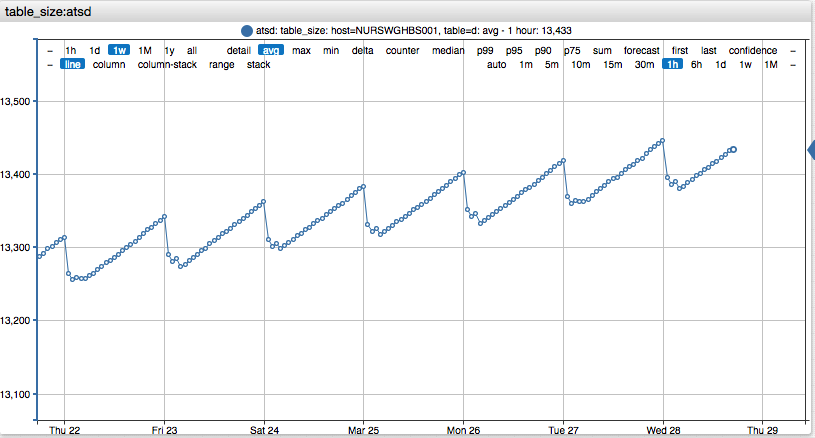
Click Store File Size to view file size growth over time. The size of the atsd_d table varies throughout the day as compaction / pruning tasks defragment and delete data in the background.
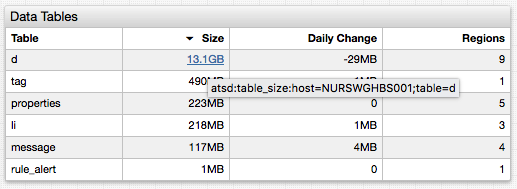
To view daily changes in tabular format, open the ATSD portal in the top menu. The table widget in the bottom left corner contains both the current table size as well as the daily change.
Space Usage Breakdown
While the breakdown of space usage within data tables is not available, the database maintains top-N rankings consisting of most frequently collected series and messages.
Review these rankings to identify the sources with the largest amount of inserted data.
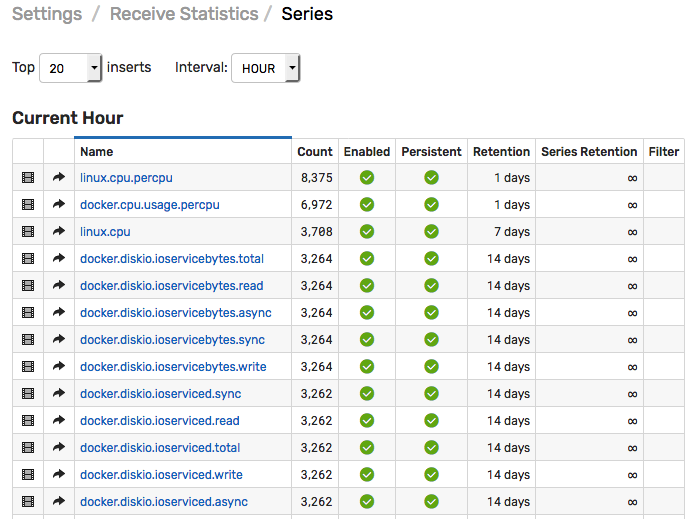
Top Metrics
The Top Inserts table for series is accessible on the Settings > Receive Statistics > Series page.
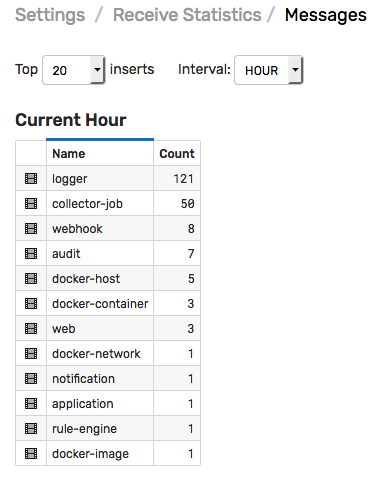
Top Message Types
The Top Inserts table for messages is accessible on the Settings > Receive Statistics > Series page.
Disk Space Monitoring
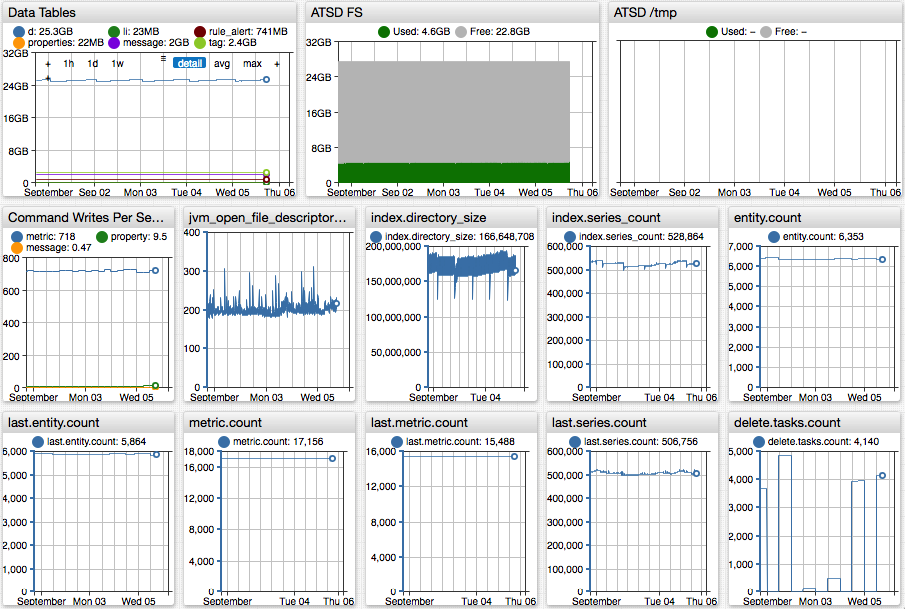
Disk Usage Portal
Import the Disk Usage portal on the Portals > Configure > Import page.
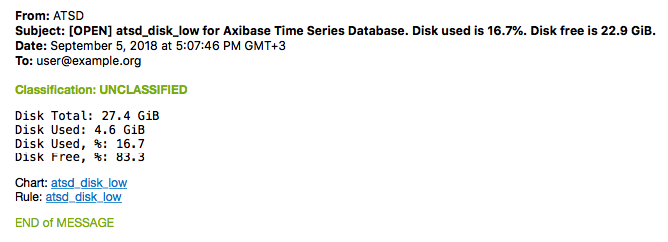
Disk Usage Alerting
Import the Disk Alert rule on the Alerts > Rules > Import page to receive an email notification when space usage exceeds 75%.
Retention Settings
The amount of time series data stored in the database is controlled using one of the following methods:
- Disabling the metric.
- Disabling metric persistence.
- Applying filters to discard values for matched series.
- Deleting expired data outside a specified retention period.
- Deleting expired series if no data has been received for the series within a specified retention period.
Since the data is deleted by staged background tasks, it takes a few days for new settings to reduce disk usage to the full extent.
Disable Metric
If the metric is disabled, the data for such metric is discarded when received. The data for disabled metrics is also ignored by the rule engine.
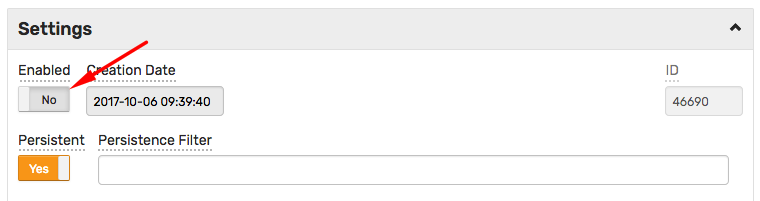
To disable a metric, open the metric editor, expand Settings section, set Enabled switch to No, and click Save.
Alternatively, use group editor to modify multiple metrics at once.
Discarded commands for disabled metrics are logged with DISABLED_METRIC token in the commands_discarded.log listed on the Settings > Diagnostics > Server Logs page:
2018-03-29 05:56:21,087;DISABLED_METRIC;series e:nurswgvml502 ms:1522302980000 t:collector=bosun.org/cmd/scollector/collectors.c_ipcount_linux t:os=linux m:scollector.collector.duration=0.003668194
Note
Existing data already stored in the database for a disabled metric is not removed from disk automatically.
Disable Persistence
The data for non-persistent metrics is not stored on disk. Such metrics are still processed in the rule engine.
To disable persistence for a metric, open the metric editor, expand Settings section, set Persistent switch to No, and click Save.
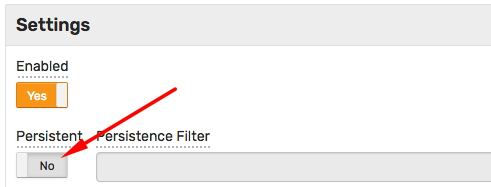
Alternatively, use group editor to modify multiple metrics at once.
Discarded commands for non-persistent metrics are logged with a NON_PERSISTENT_METRIC token in the commands_discarded.log:
2018-03-29 05:56:21,518;NON_PERSISTENT_METRIC;series e:nurswgvml010 ms:1522302981000 t:remote=192.0.2.1 m:ntp.stratum=2
Note
Existing data already stored in the database for a non-persistent metric is not removed from disk automatically.
Set Persistence Filter
To selectively discard some series generated by the metric, define a persistence filter expression.
Only series that satisfy the condition are stored on disk. All series for this metric continue to be processed in the rule engine.
To set the filter for a metric, open the metric editor, expand the Settings section, enter an expression into the Persistence Filter field, and click Save.
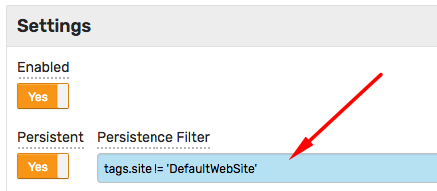
Alternatively, use group editor to modify multiple metrics at once.
Discarded commands for metrics with persistence filters are logged with a FILTERED_METRIC token in the 'commands_discarded.log':
2018-03-29 05:56:28,075;FILTERED_METRIC;series e:nurswgvmw016 ms:1522302699000 t:method=copy t:site=DefaultWebSite m:iis.requests=0
Note
Existing data already stored in the database is not removed from disk automatically, even if the series no longer matches the filter.
Filter Examples
- Discard (do not persist) series with tag
siteequal toDefaultWebSite
tags.site != `DefaultWebSite`
- Discard series with tag
idstarting withlo
tags.id NOT LIKE 'lo*'
- Discard series with tag
diskequal/bootor starting with/run
tags.disk != '/boot' && tags.disk NOT LIKE '/run*'
- Discard series if tag
mount_pointmatches any element in named collectionignore-collector-mount-points.
!likeAny(tags.mount_point, collection('ignore-collector-mount-points'))
/boot
/dev*
/proc*
/run*
/var*
/sys/fs/cgroup
- Discard series if tag
idis contained in named collectionfilesystem_ignore.
!collection('filesystem_ignore').contains(tags.id)
/run
/run/shm
/dev
/run/lock
/boot
Delete Expired Data
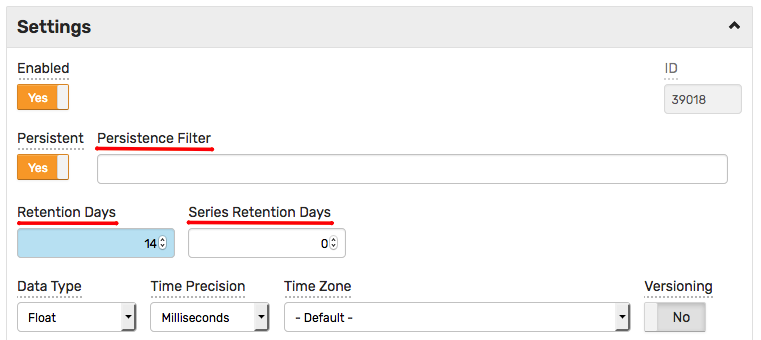
To delete old data beyond the retention period for the selected metric, open the metric editor, expand the Settings section, and set the Retention Days field to a positive integer, click Save.
To disable deletion, set the Retention Days field back to zero.
This causes the expired data, older than current time minus the specified retention period, to be deleted by a background task which is executed once a day during night-time hours.
Group Editor
To apply this setting to multiple metrics at once, open the Metrics tab and enter a pattern for matching multiple metrics by name.
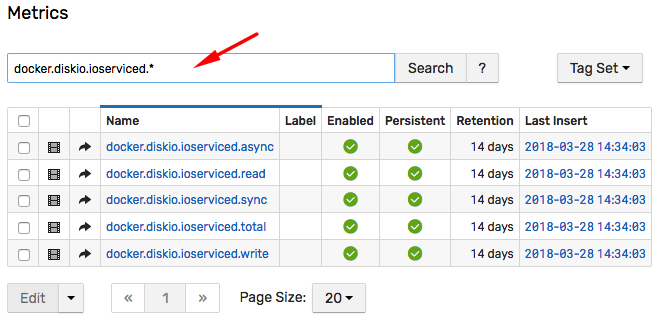
Check individual records or select all records by checking the box in the header.
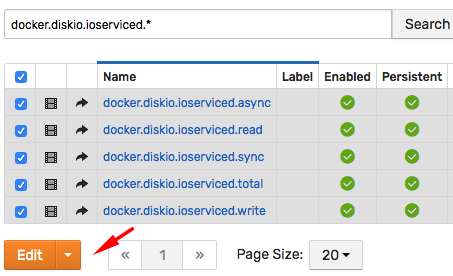
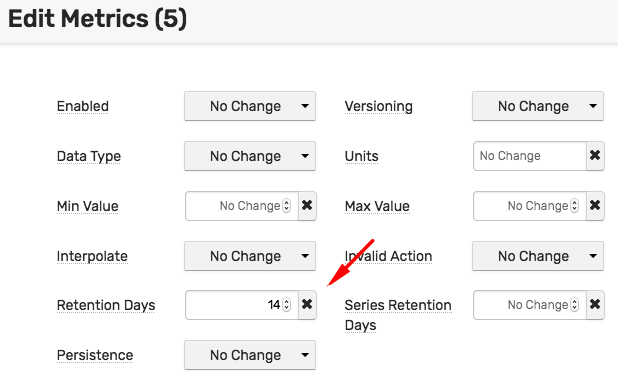
Open the group editor and modify the Retention Days setting. To disable deletion, set Retention Days to zero.
Delete Expired Series
To delete all data for an old series, open the metric editor, expand the Settings section, and set the Series Retention Days field to a positive integer, click Save.
To disable deletion, set the Series Retention Days field back to zero.
Alternatively, use group editor to modify multiple metrics at once.
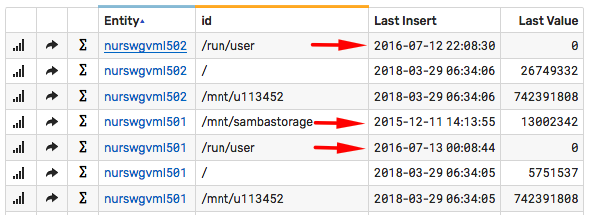
This setting causes all data to be deleted for those series which have not received new values for more than the specified number of days. If the series has recent data, no data for such a series is deleted. This setting cleans the database from old/discontinued series while retaining all data for active series.
If Series Retention Days is set to 1 year in the example below, the database deletes three highlighted series that have not been updated since 2015/2016. The data for the remaining active series is left untouched.
The data is deleted by a background task which is executed once a day during off-peak hours.
Delete Entities
Utilize ATSD Python client to delete entities matching specific conditions.
For example, run the entities_expression_delete.py script to delete entities which are not collecting any data.
python3 entities_expression_delete.py
Scheduled Tasks
The expired data is deleted from the database on a schedule which is synchronized with other data management tasks.
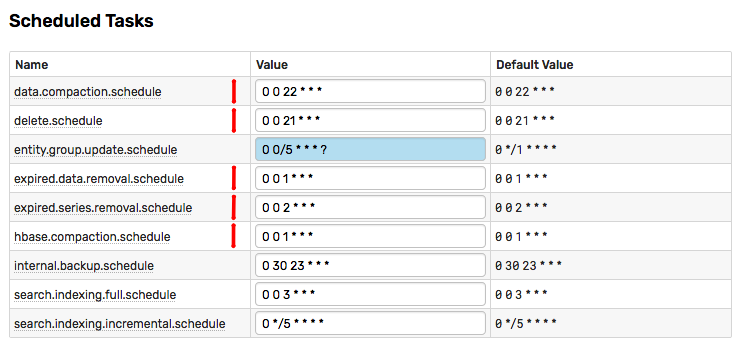
The optimal sequence of tasks is:
delete.scheduleexpired.series.removal.scheduleexpired.data.removal.scheduledata.compaction.schedulehbase.compaction.schedule
Schedule the tasks to rune once a day during off-peak/night-time hours. Change the hbase.compaction task to tune once a week on large clusters.
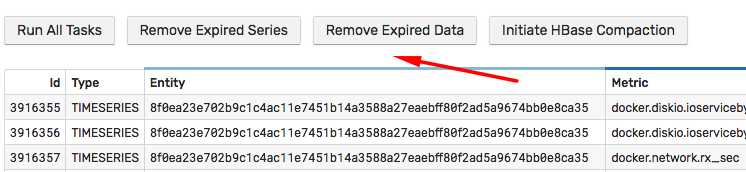
To trigger these tasks manually, open Settings > Storage > Delete Tasks and execute them manually.
Deleting with UI
Deleting Entities
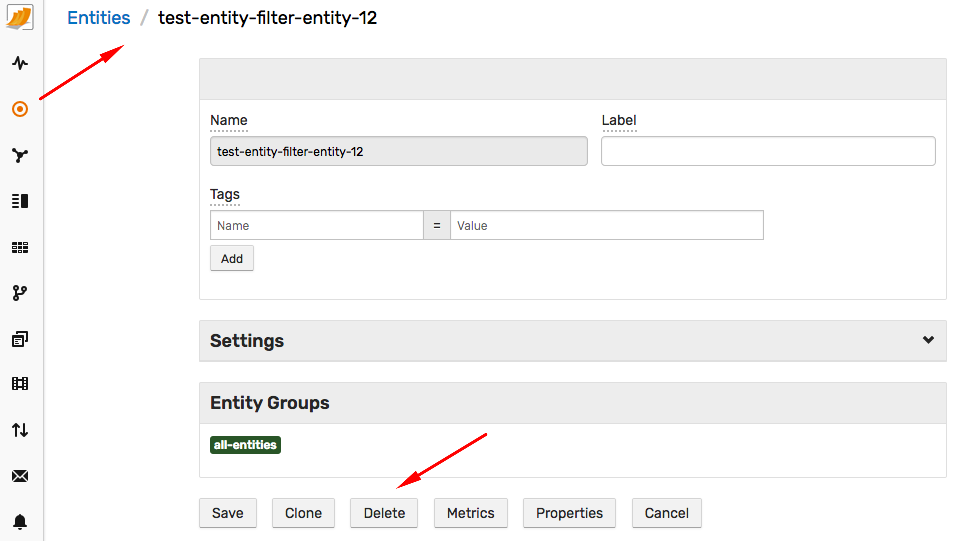
To delete a single entity, locate the entity on the Entities tab, open the entity editor and click Delete.
This causes all series collected for the entity to be deleted.
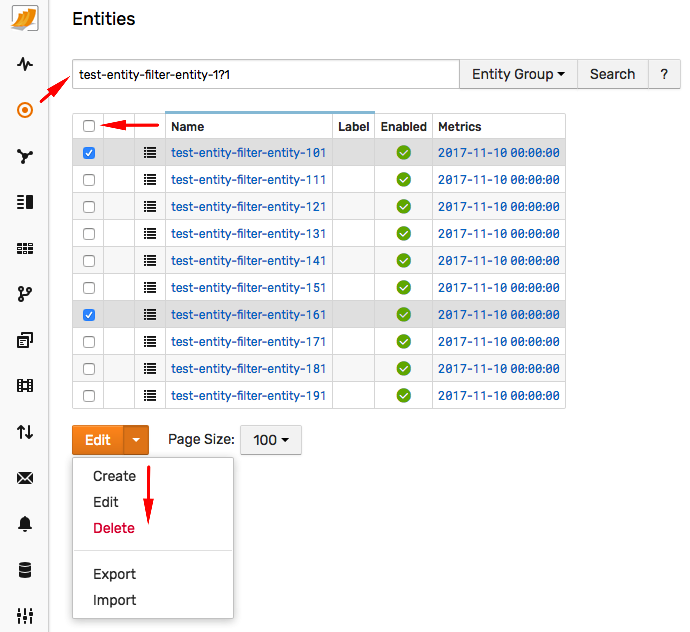
To delete multiple entities, specify the search pattern on the Entities tab.
Select all or multiple matching entities using the checkbox controls, and click Delete from the split-button.
Series can be re-inserted for a new entity with the same name without any collisions. The new entity is assigned a unique identifier.
Deleting Metrics
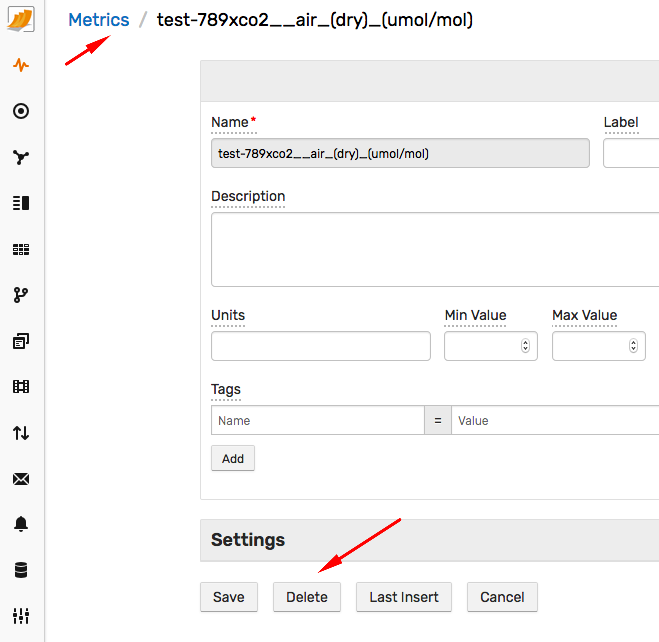
To delete a single metric, locate the metric on the Metrics tab, open the metric editor and click Delete.
This causes all series collected for the metric to be deleted.
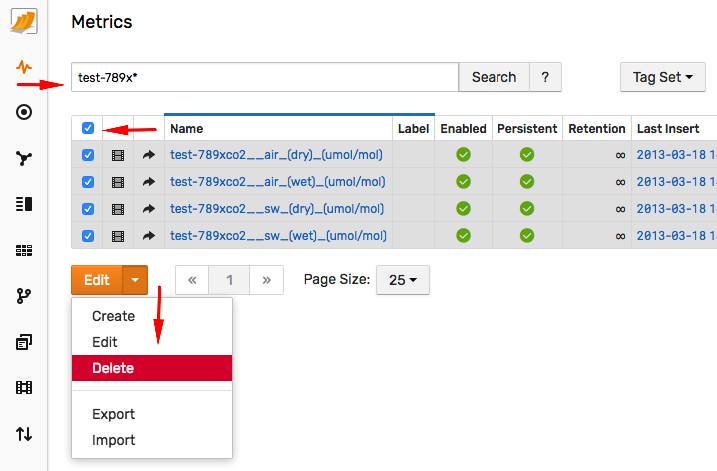
To delete multiple metrics, specify the search pattern on the Metrics tab.
Select all or multiple matching metrics using the checkbox controls, and click Delete in the split-button.
Series can be re-inserted for a new metric with the same name without any collisions. The new metric is assigned a unique identifier.
Deleting Series
Note
Only one series can be deleted at a time.
Locate the series.
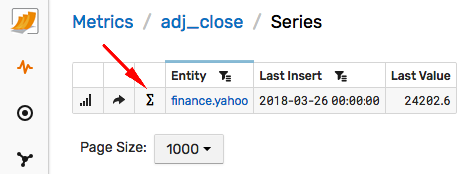
Open the Series Statistics page. Click Delete.
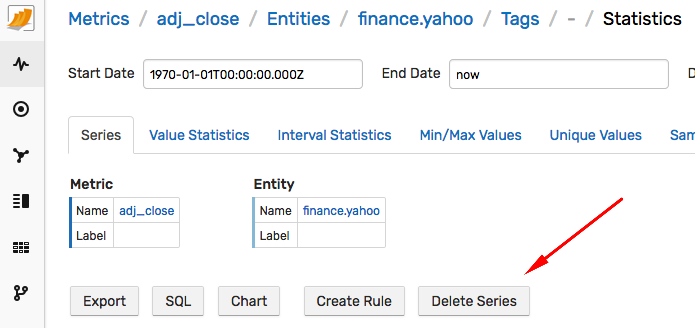
Note that series removed with this method is masked with a Delete marker which prevents the data for the same series from being visible until the next HBase compaction.
Deleting Properties
Open the Properties page for the specified entity.
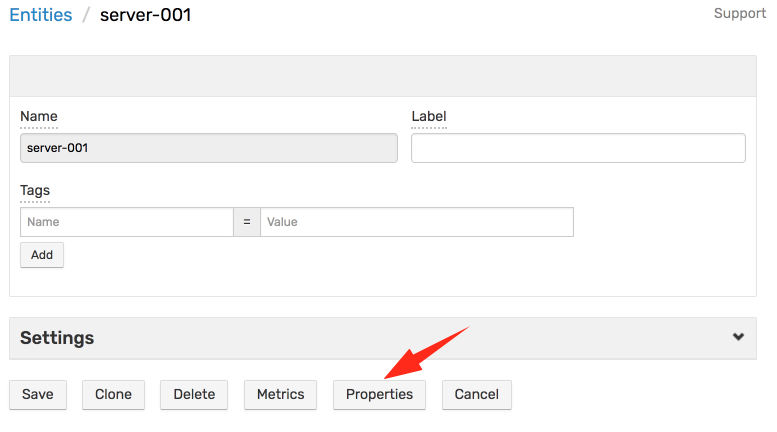
Select the property keys to be deleted and click Delete by expanding the split-button.
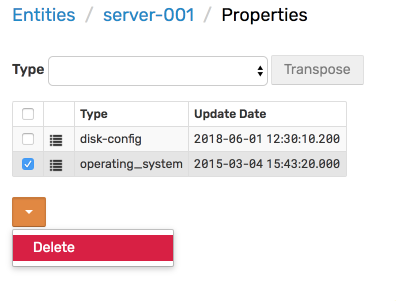
Note that properties removed with this method are masked with a Delete marker which prevents the data for the same property type and entity from being visible until the next HBase compaction.
Deleting Messages
Not supported in the web interface.
Deleting with API
Note that series and properties removed with these methods are masked with Delete markers which prevents the data for the same series or property from being visible until the next HBase compaction.
Deleting with API Clients
Refer to ATSD Python client record cleanup examples.
Summarizing Expiring Data
To retain statistical averages based on expiring detailed data, use scheduled SQL queries with the Store option.
Schedule the queries to execute before the raw data is deleted.
In the example below, the query runs every night (at 00:15) to calculate hourly average and maximum for each series in the underlying metrics.
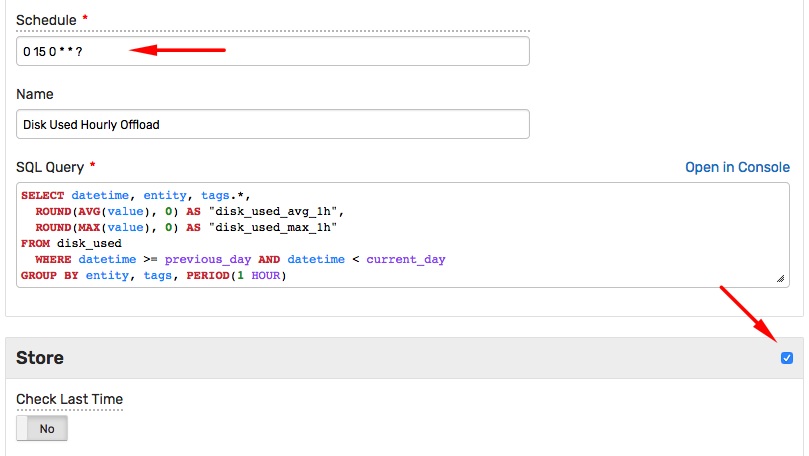
The derived metrics are then stored under new names.
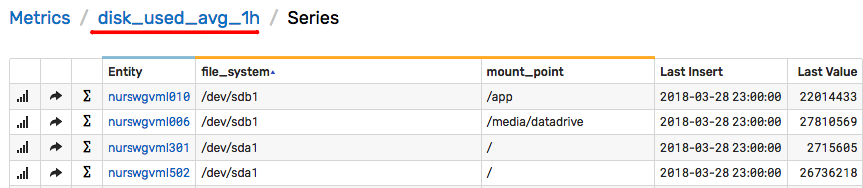
SELECT datetime, entity, tags.*,
  -- specify derived metric names, for example {metric}_{function}_{period}
  ROUND(AVG(value), 0) AS "disk_used_avg_1h",
  ROUND(MAX(value), 0) AS "disk_used_max_1h"
  -- specify metric with raw data to summarize
FROM disk_used
  WHERE datetime >= previous_day AND datetime < current_day
  -- choose summarization period, such as 1-hour
GROUP BY entity, tags, PERIOD(1 HOUR)
Understanding Data Growth
In addition to more data being collected for existing series, data is continuously inserted for new metrics, entities, and series.
To monitor these parameters, create a new portal with the following table widget:
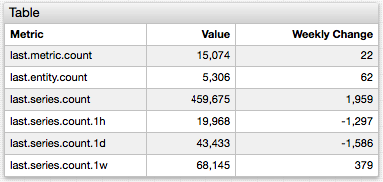
The widget displays the current number of records as well as weekly change.
last.series.count.{period} metrics display the number of updated series within the specified period.
[widget]
  type = table
  timespan = 1 week
  entity = atsd

  column-entity = null
  column-time = null

  [column]
    key = value
    label = Value
  [column]
    key = delta
    label = Weekly Change
    series-value = delta()

  [series]
    metric = last.metric.count
  [series]
    metric = last.entity.count
  [series]
    metric = last.series.count
  [series]
    metric = last.series.count.1h
  [series]
    metric = last.series.count.1d
  [series]
    metric = last.series.count.1w