Computed Metrics
Create computed metrics in any portal using existing metrics. Manipulate underlying series or join multiple series to perform ratio or roll-up calculations, such as percentage or average values respectively.
Use the replace-value setting and corresponding fields to replace the input value when no references to other series are required.

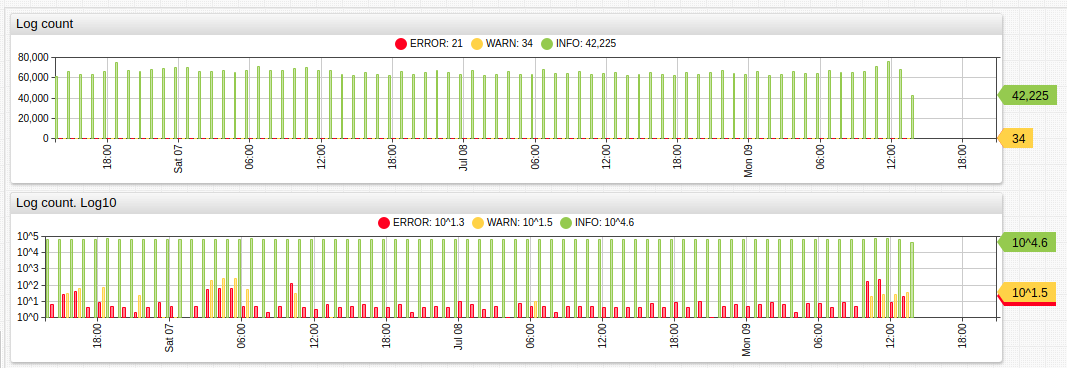
In the example above, the second chart uses log10 values to compare samples of different magnitude.
replace-value = Math.log10(value)

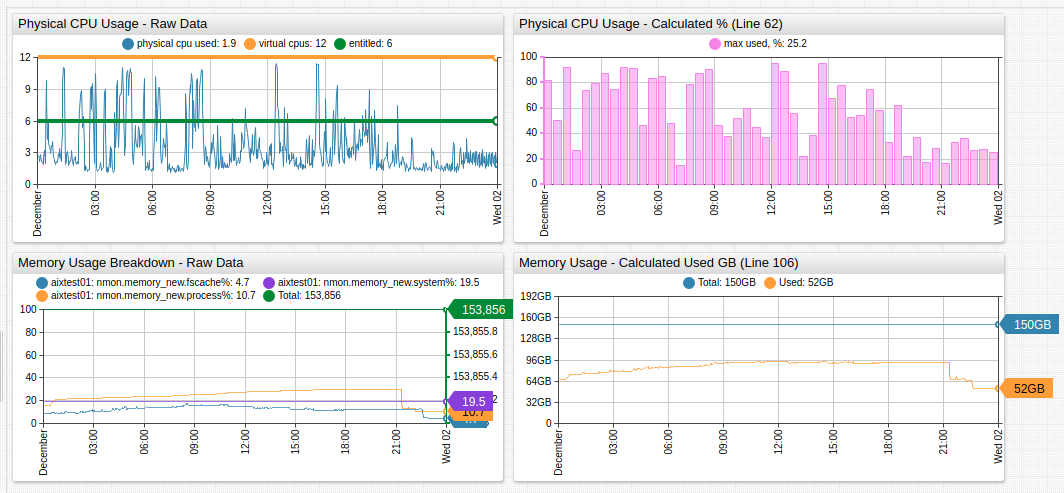
In this example, the underlying series are hidden and a new visible series is created which displays the ratio of two hidden series multiplied to a percentage value. To reference other series, such underlying series must be assigned unique identifiers with the alias setting.
[series]
  metric = nmon.logical_partition.physicalcpu
  alias = pcpu
  display = false
[series]
  metric = nmon.logical_partition.virtualcpus
  alias = vcpu
  display = false
[series]
  label = max used, %
  value = 100*value('pcpu')/value('vcpu')
  color = violet
In addition to obtaining the last value at a given time for the referenced series with the value('alias') function, it is also possible to obtain period statistics using statistical functions. If a custom period is required, the syntax is avg(alias, period), for example avg('s1', 1 hour) aggregates data from series s1 hourly.
Extrapolation
Computed series values are calculated for all unique timestamps of the underlying series.
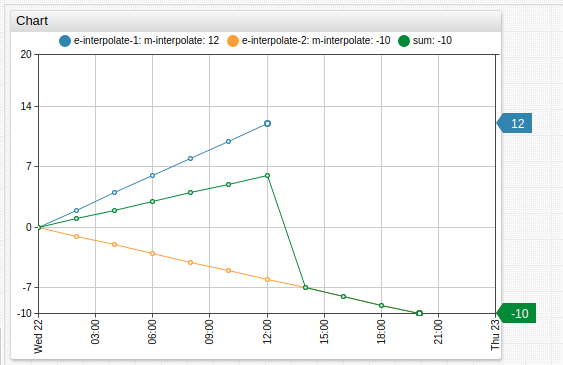
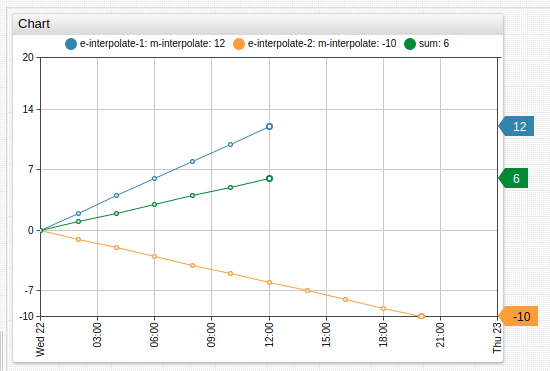
If one of the series is lagging behind, its value at later points is extrapolated from its last value.

Disable extrapolation by setting computed values to null for timestamps after the minimum last time of the underlying metrics.

