Calendar Chart
Overview
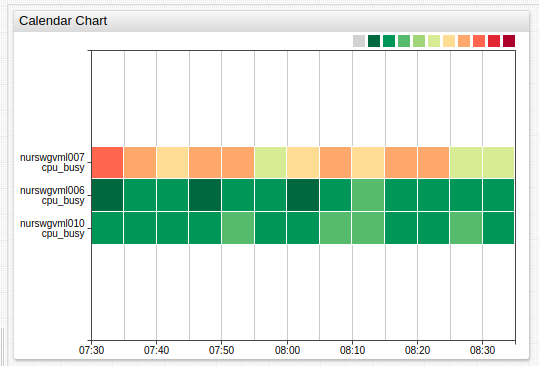
The Calendar Chart displays the deviation of aggregated series values for a calendar period from a specified threshold. Series values within each period are aggregated by client statistical function and assigned a color which reflects the magnitude of deviation.
[widget]
  type = calendar

  thresholds = 0,30,60,100
  colors = green,yellow,red

  timespan = 12 hour
  summarize-period = 1 hour
  summarize-statistic = percentile(95)

  [series]
    metric = cpu_busy
    entity = nurswgvml0*

Widget Settings
- The settings apply to the
[widget]section. - Common
[widget]settings are inherited.
| Name | Description | |
|---|---|---|
summarize-period | Period specified in time units to split loaded time series into calendar segments. Format: count time_unit.Default value: 5 minute.Example: summarize-period = 1 hour | ↗ |
summarize-statistic | Statistical function applied to values within each period. Refer to Client Aggregators for possible values. Default value: avg.Example: summarize-statistic = percentile(75) | ↗ |
palette-ticks | Display legend labels. Possible values: false, true.Default Value: false.Example: palette-ticks = true | ↗ |
rotate-palette-ticks | Rotate legend labels. Possible values: false (horizontal), true (vertical).Default value: false.Example: rotate-palette-ticks = true | ↗ |
range-merge | Compute a single range for all series with minimum and maximum from all loaded series. Possible values: false, true.Default value: false.Example: range-merge = true | ↗ |
sort | Sort rows by label or value of statistic function. Supported ascending (ASC) and descending (DESC) order.Possible values: • name - sorts by label• stat_name('count unit')- sorts by statistic within periodExample: sort = name DESC | ↗ ↗ |
centralize-ticks | Center time and date markers over summarize periods. Possible values: false, true.Default value: false.Example: centralize-ticks = true | ↗ |
ticks-time | Tick marks on the time axis. Default value: 10.Example: ticks-time = 5 | ↗ |
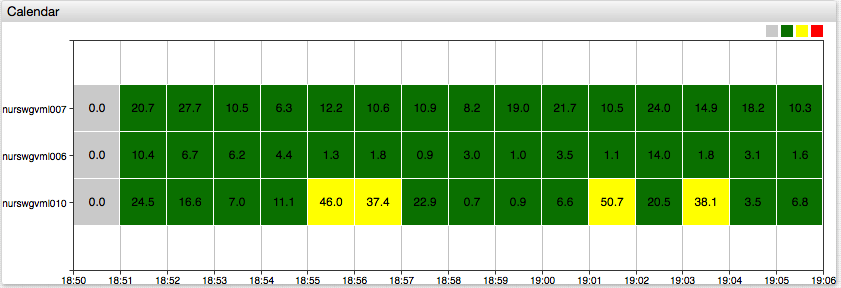
data-labels | Display values inside colored rectangles formatted according to format setting. Default value: false.Example: data-labels = true | ↗ |
Summarize Period Panel
| Name | Description | |
|---|---|---|
display-panels | Summarize-period panel visibility. Possible values: false, true, hover.Default value: hover.Example: display-panels = true | ↗ |
expand-panels | Expand controls in the summarize-period panel. Possible values: false, true, compact.Default value: compact.Example: expand-panels = true | ↗ |
periods | List of custom aggregation periods on the summarize-period panel. Each period is specified as the number of time units. Format: count time_unit.Example: periods = 20 minute, 4 hour. The periods must be comma-separated. | ↗ |
panels-period | Comma-separated list of aggregation periods to replace the default ones in summarize-period panel. Example: panels-period = 1 hour, 1 day, 1 week | ↗ |
Panel features:
Double-click between controls to insert an inner interval:

Drag to drop control:
Series Color Settings
- The settings apply to the
[widget]or[series]section. - Common
[series]settings are inherited.
| Name | Description | |
|---|---|---|
thresholds | Threshold values. The number of specified colors must be 1 fewer than the number of thresholds.Example: thresholds = 0, 50, 90, 100 | ↗ |
colors | Comma separated list of color names or hex codes, assigned to threshold ranges. The number must be 1 fewer than the number of thresholds.Example: colors = green, yellow, redRecommended color palette tools: colorhexa, material.io. | ↗ |
color-range | Color palette assigned to threshold ranges. Possible values: color names. Built-in ranges: red, blue, black.Example: color-range = black | ↗ |
gradient-count | Number of gradients per threshold range. Default value: 3.Example: gradient-count = 2 | ↗ |
Sort By Statistic
Aggregated series can be sorted using statistic, calculated for last aggregated values within the particular period, specified as the number of time units:
stat_name('count unit')
# For example:
sum('5 minute')
Period can be both quoted and unquoted. Supported statistic functions:
sum- sum of values during the periodmin- minimum value during the periodmax- maximum value during the periodavg- average of values during the periodfirst- first value received during the periodlast- Last value received during the period
Examples
Data Labels
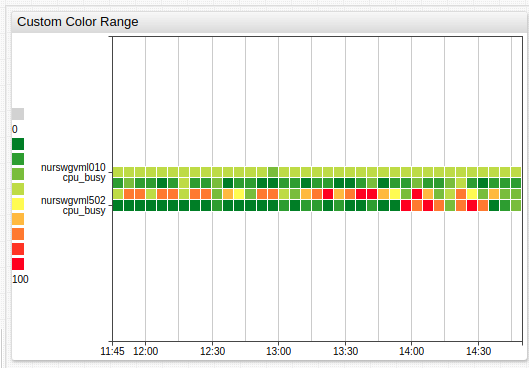
Custom Color Range
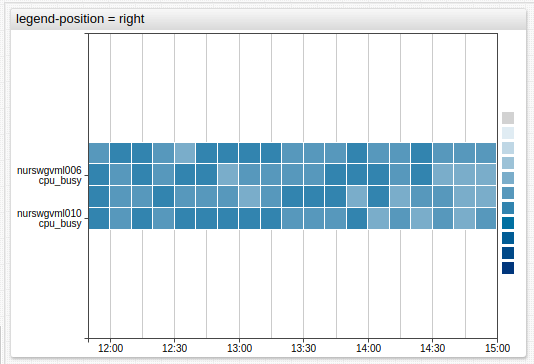
Legend Position
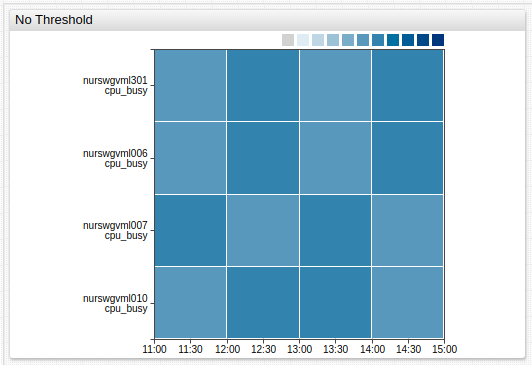
No Threshold
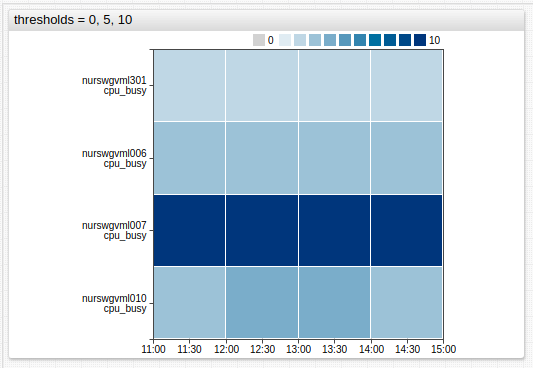
Threshold
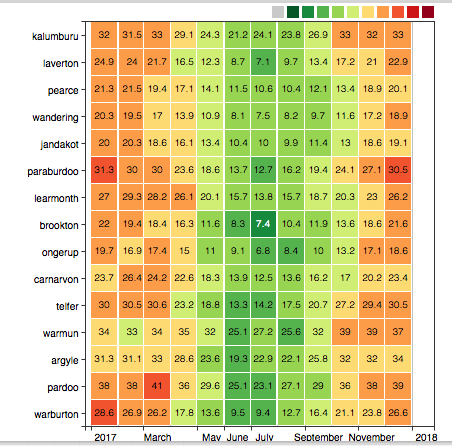
Multiple Weather Stations