Graph Widget
Overview
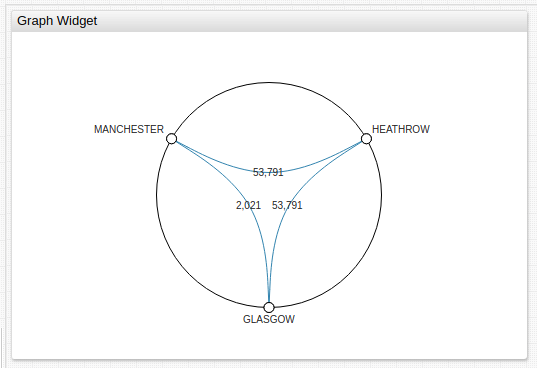
The Graph Widget displays the topology and relationships of servers, virtual machines, and managers alongside corresponding statuses.
[widget]
  type = graph
  link-data = true
  timespan = 1 year
  metric = uk-air.total_pax_this_period

  [node]
    id = HEATHROW
  [node]
    id = GLASGOW
  [node]
    id = MANCHESTER
Widget Settings
- The settings apply to the
[widget]section. - Common
[widget]settings are inherited.
| Name | Description | |
|---|---|---|
mode | Determines the overall look of the widget. Possible values: hierarchy, non-hierarchy.Default value: non-hierarchy.Example: mode = hierarchy | ↗ |
layout | Widget layout in non-hierarchy mode.Possible values: circle, rectangle.Default value: circle.Example: layout = rectangle | ↗ |
tension | Edge degree curvature. Corresponds to the parameter C in the formula for the cardinal spline.Possible values: 0 (straight line) to 1.Default value: 0.9.Example: tension = 0.33 | ↗ |
duration | The duration of a animation during graph geometry change, in milliseconds. Default value: 1000.Example: duration = 1500 | ↗ |
arrows | Arrows on directed edges Possible values: false, true.Default value: false.Example: arrows = true | ↗ |
node-connect | Connect vertices on the perimeter Possible values: false, true.Default value: true.Example: node-connect = false | ↗ |
link-thresholds | Threshold for time series attached to the edges. Supports both JavaScript and percentile functions.Example: link-thresholds = percentile(50), percentile(95) | ↗ |
link-colors | Color to indicate the threshold of time series. Attached to the edges and separated by commas. Example: link-colors = red, yellow, green | ↗ |
link-widths | Width to indicate the thresholds of the time series tied to the edges and separated by commas or spaces. Example: link-widths = 5 | ↗ |
node-thresholds | Threshold for time series tied to vertices. Supports JavaScript, percentile functions, or can be set as an array.Example: node-thresholds = percentile(10),percentile(95) | ↗ |
node-colors | Color to indicate the threshold of time series that are bound to vertices and separated by commas. Example: node-colors = red, yellow, green | ↗ |
node-radiuses | Radii of the lighting for the display of the time series thresholds linked to the vertices and separated by commas or spaces. Example: node-radiuses = 10, 20, 30, 40 | ↗ |
node-radius | Radius of the vertex in pixels. Not valid in hierarchy mode.Example: node-radius = 10 | ↗ |
padding | Offset from the edge of the container in pixels. Example: padding = 50 | ↗ |
disconnected-node-display | Show vertices without edge. Possible values: false, true.Default value: true.Example: disconnected-node-display = false | ↗ |
node-labels | Display vertex labels. Possible values: false, true.Default value: false.Example: node-labels = false | ↗ |
link-labels | Display edge labels. Possible values: false, true.Default value: false.Example: link-labels = true | ↗ |
link-data | Series last value next to the link-label.Example: link-data = true | ↗ |
link-color-range | Color scheme for link-threshold.Possible settings: red, blue, black. Example: link-color-range = red | ↗ |
link-label-zoom-threshold | Parameter value is a value of scale when labels appear based on edge threshold.value > 1: Labels appear on zoom in.Example: link-label-zoom-threshold = 2 | ↗ |
node-label-zoom-threshold | Parameter value is a value of scale when labels appear based on vertex threshold.value > 1: Labels appear on zoom in.Example: node-label-zoom-threshold = 2 | ↗ |
auto-padding | Add padding if labels overflow container. Possible values: false, true.Default value: true.Example: auto-padding = false | ↗ |
link-width-order | Sort links according to their width. Possible values: top, bottom, undefined.Default value: undefined.Example: link-width-order = top | ↗ |
Controls
| Name | Description | |
|---|---|---|
node-data | Show or hide time series last value information next to the corresponding image of the vertices. Possible values: false, true.Example: data = true | ↗ |
depth | Set the depth of the displayed vertex hierarchy. Specify a value from 1 to a maximum height of the vertex tree plus 1, the last level corresponds to the edges.Possible values: Number. Default value: Equal to the height of the displayed vertex tree. Example: depth = 3 | ↗ |
bundle | Hierarchical contraction of edges (Danny Holten algorithm). Possible values: false, true.Default value: true.Example: bundle = false | ↗ |
effects | Animation when changing the geometry of the graph. Possible values: false, true.Default value: false.Example: effects = true | ↗ |
node-collapse | Collapse sector peaks when clicked. Possible values: false, true.Default value: true.Example: node-collapse = true | ↗ |
link-animate | Animation of directed edges. Possible values: false, true.Default value: false.Example: link-animate = true | ↗ |
Node Settings
- The settings apply to the
[node]section.
| Name | Description | |
|---|---|---|
id | Required Unique name of the vertex. Example: id = HEATHROW | ↗ |
parent | ID of parent vertex. Example: parent = HEATHROW | ↗ |
Link Settings
- The settings apply to the
[link]section.
| Name | Description | |
|---|---|---|
id | Unique edge name. Example: id = HEATHROW - GLASGOW | ↗ |
nodes | Vertices connected by an edge. ID of vertices, separated by a comma or hyphen for undirected edges, -} or {- for directed edges.If vertex ID contains a hyphen, it must be shielded using "" double quotes.Example: nodes = HEATHROW-MANCHESTER | ↗ |
series | alias of time series associated with the edge.Example: series = s1 | ↗ |
tooltip | Link tooltip. Example: tooltip = Passenger Information | ↗ |
label | Label text. Default value: element-id.Example: label = Airport Usage | ↗ |
Series Settings
- The settings apply to the
[series]section. - Common
[series]settings are inherited.
| Name | Description | |
|---|---|---|
links | List of edges associated with this series is defined by an ID or edge ID of the corresponding vertices with a hyphen. When edge ID contains a hyphen, it must be shielded with "" double quotes.Example: links = HEATHROW - MANCHESTER | ↗ |
node-alert-style | Style of vertices when alert-expression is true.Example: node-alert-style = fill: red | ↗ |
link-alert-style | Style of edges when alert-expression is true.Example: link-alert-style = stroke: red | ↗ |
Properties Settings
- The settings apply to the
[property]section. - In
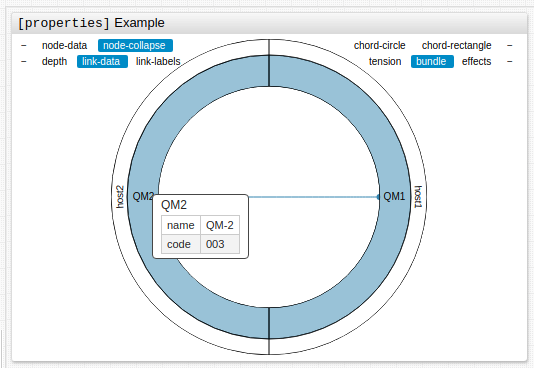
[node]or[series]section, define properties displayed on mouseover. - If a value contains
=or\escape them with a backslash:\=or\\, respectively. - Use the
>context setting displayed in the tooltip before the[properties]tooltip table.- Within the
>context setting, create a table using standard HTML parameters:>table class,tbody,tr,td.
- Within the
[properties]
  name = QM-2
  code = 003
Examples
Structure
The structure of the graph is defined by the description of its vertices and edges. Use [node] settings to describe each vertex, and define the hierarchy of vertices with the parent setting, which sets the predecessor. Use [link] settings to describe the edges. Adjacent edges, with vertices, are determined by [node] settings.
Link series to edges or vertices by indicating the alias in the series parameter of [link] or [node] settings. Alternatively, list the loaded edges or vertices in the links or nodes of the [series] settings.
Alert Expression
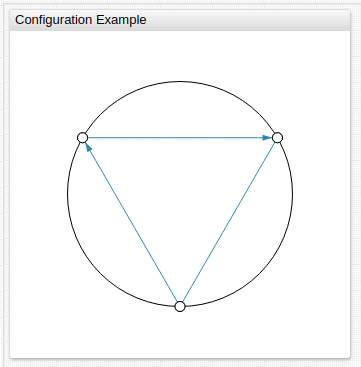
In the event of an alert-expression response on the time series of the vertex or edge to which the time series is tied. alert-style setting value can be either string or script. If alert-style is script, the variable alert is available, and it is equal to the value that the alert returns. The following styles are applied (in a specified order) in the parameters below:
Example Syntax
/* Modify stroke width of series line on alert */
link-alert-style = if (alert > 99) return 'stroke-width:3px';

/* modify color of node on alert */
node-alert-style = if (alert > 99) return 'fill:red';
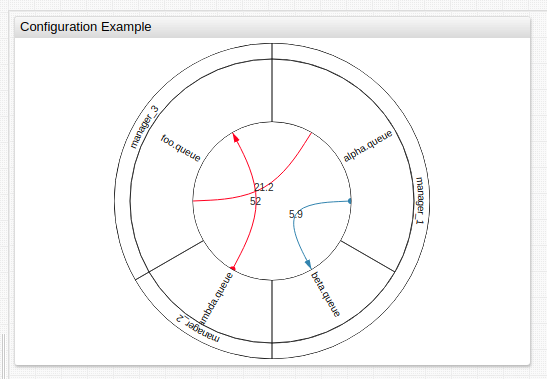
Configuration Example 2
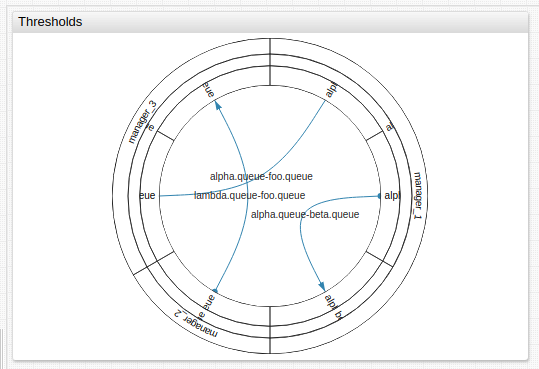
Thresholds
Set thresholds for time series which are tied to vertices or edges using link-thresholds or node-thresholds parameters in [widget] settings.
Color and width parameters are applied to the edge and vertices based on link-widths and link-colors, additionally node-radiuses and node-colors in [widget] settings.
alert-expression styles are superimposed over threshold styles.
