Jetty Web Server
Overview
This document describes how to collect JMX metrics exposed by Jetty (Web server) for long-term retention and monitoring in Axibase Time Series Database.
Requirements
- Jetty
6.+
Installation Steps
Enable JMX in Java Application
Configure your Java application for JMX monitoring as described by the JMX Job Documentation.
Import Jetty job into Axibase Collector
- Open the Jobs menu and click Import. Upload the jetty-job.xml file.
Configure Jetty JMX Connection
- Open the Jobs menu and select JMX. Open the
jmx-jettyjob. - For each JMX Configuration:
- Provide connection parameters to the target Jetty:
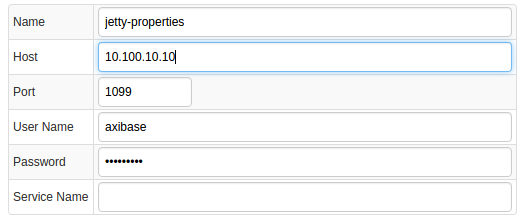
- Click Test and ensure that the result is correct:

Schedule the Job
- Open the
JMX Jobpage and click Run for the Jetty JMX job. - Ensure that the job status is
COMPLETEDand Items Read and Sent commands are greater than 0.

- If there are no errors, set job status to Enabled and save the job.
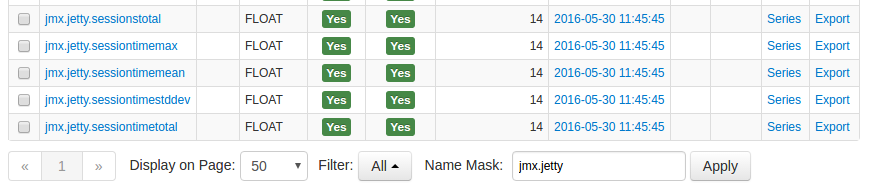
Verify Metrics in ATSD
- Log in to ATSD.
- Click the Metrics tab and filter metrics by name
jmx.jetty*.
Viewing Data in ATSD
Metrics
- List of collected Jetty metrics.
Properties
- List of collected Jetty properties.
Entity Group
- Open Admin menu and select Entity Groups, click Import, and upload jetty_entity_group.xml.
- Select the imported
jetty-web-servergroup. - Verify that the group contains your Jetty hosts.
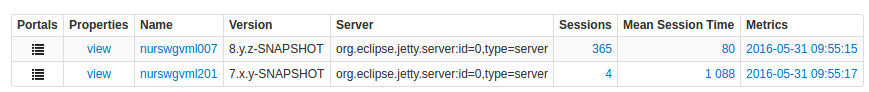
Entity Views
- Open Entity Views menu and select Configuration, click Import and upload jetty_entity_view.xml.
- Select the imported
Java Applicationsview. - Select the Entity Group that you created earlier.
- Click View and browse information about your entities.
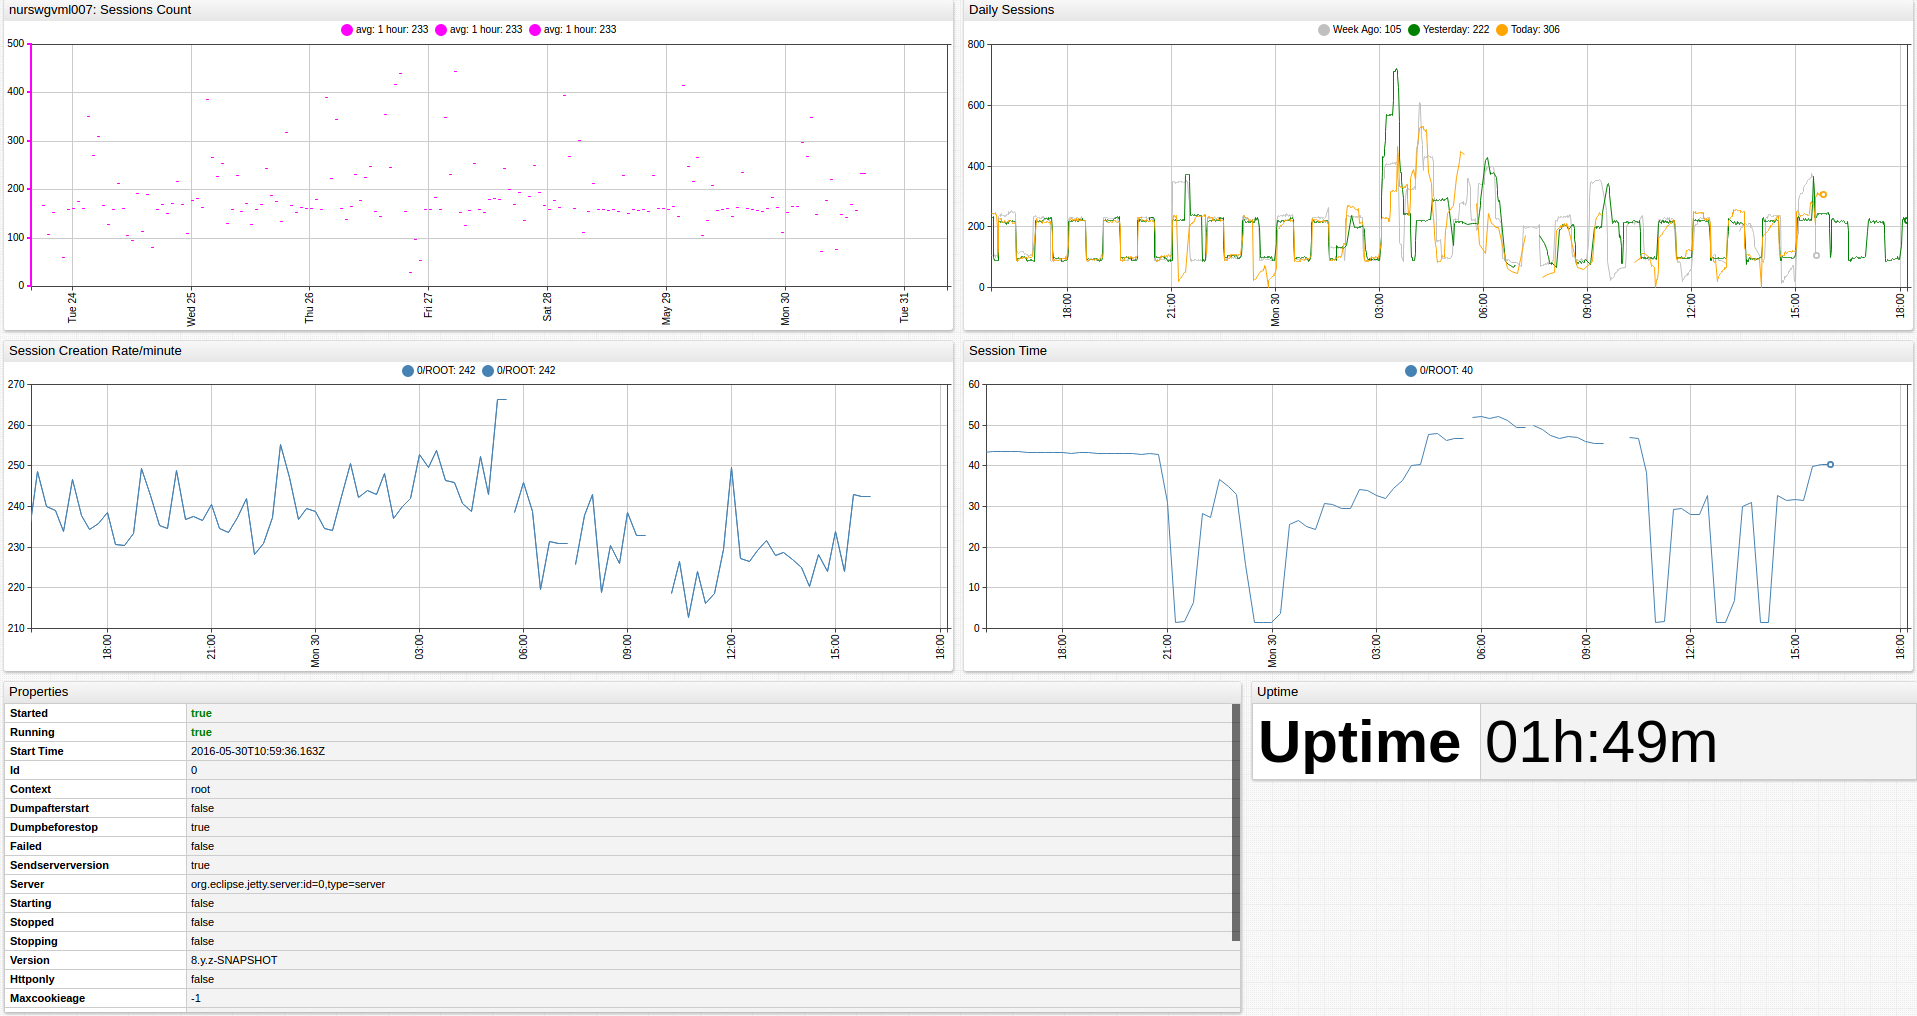
Portal
- Open the Portals and select Configure, click Import and upload jetty_portal.xml.
- Click the Assign link and associate the portal with the entity group you created earlier.
- Open Entities tabs, find the java application by name, and click the portal icon.