
Java Virtual Machine
Overview
This document describes how to collect JMX metrics exposed by Java applications for long-term retention and monitoring in Axibase Time Series Database.
This integration enables both performance monitoring (garbage collection, load, threads, heap/offheap memory), availability monitoring (system uptime counter), as well as configuration tracking by notifying of any changes in the system properties.
Requirements
- JRE/JDK
6+
Installation Steps
Enable JMX in Java Application
Configure your Java application for JMX data collection as described by the JMX Job Documentation.
Import JVM Job into Axibase Collector
- On the Jobs page, select Import from the split-button at the bottom of the page and upload the
jmx-jvm-job.xmlfile.
Configure JMV JMX Connection
- Open the Jobs menu and select JMX. Click the
jmx-jvmjob. - For each JMX Configuration:
- Provide connection parameters to the target JVM:
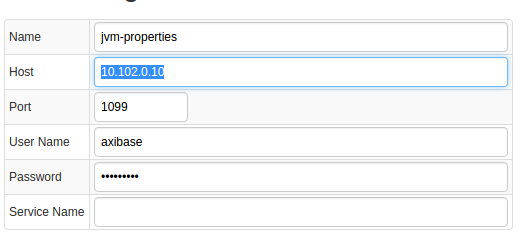
- Click Test:

Schedule the Job
- Open the JMX Job page and click Run for the JVM JMX job.
- Ensure that the job status is
COMPLETEDand Items Read and Sent commands are greater than 0.

- If there are no errors, set the job status to Enabled and save.
Verify Metrics in ATSD
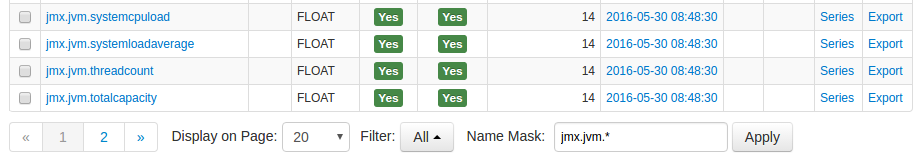
- Log in to ATSD.
- Open Metrics tab and filter metrics by name
jmx.jvm*.
Viewing Data in ATSD
Metrics
- List of collected JVM metrics.
Properties
- List of collected JVM properties.
Entity group
- Open Settings menu and click Entity Groups, select Import from the split-button, and upload
jvm_entity_group.xml. - Select the imported
java-virtual-machinegroup. - Verify that the group contains your JVM hosts.
Entity Views
- Open the Entity Views menu and select Configuration, click Import, and upload
jvm_entity_view.xml. - Select the imported
Java Applicationsview. - Select the Entity Group that you created earlier.
- Click View and browse information about your entities:

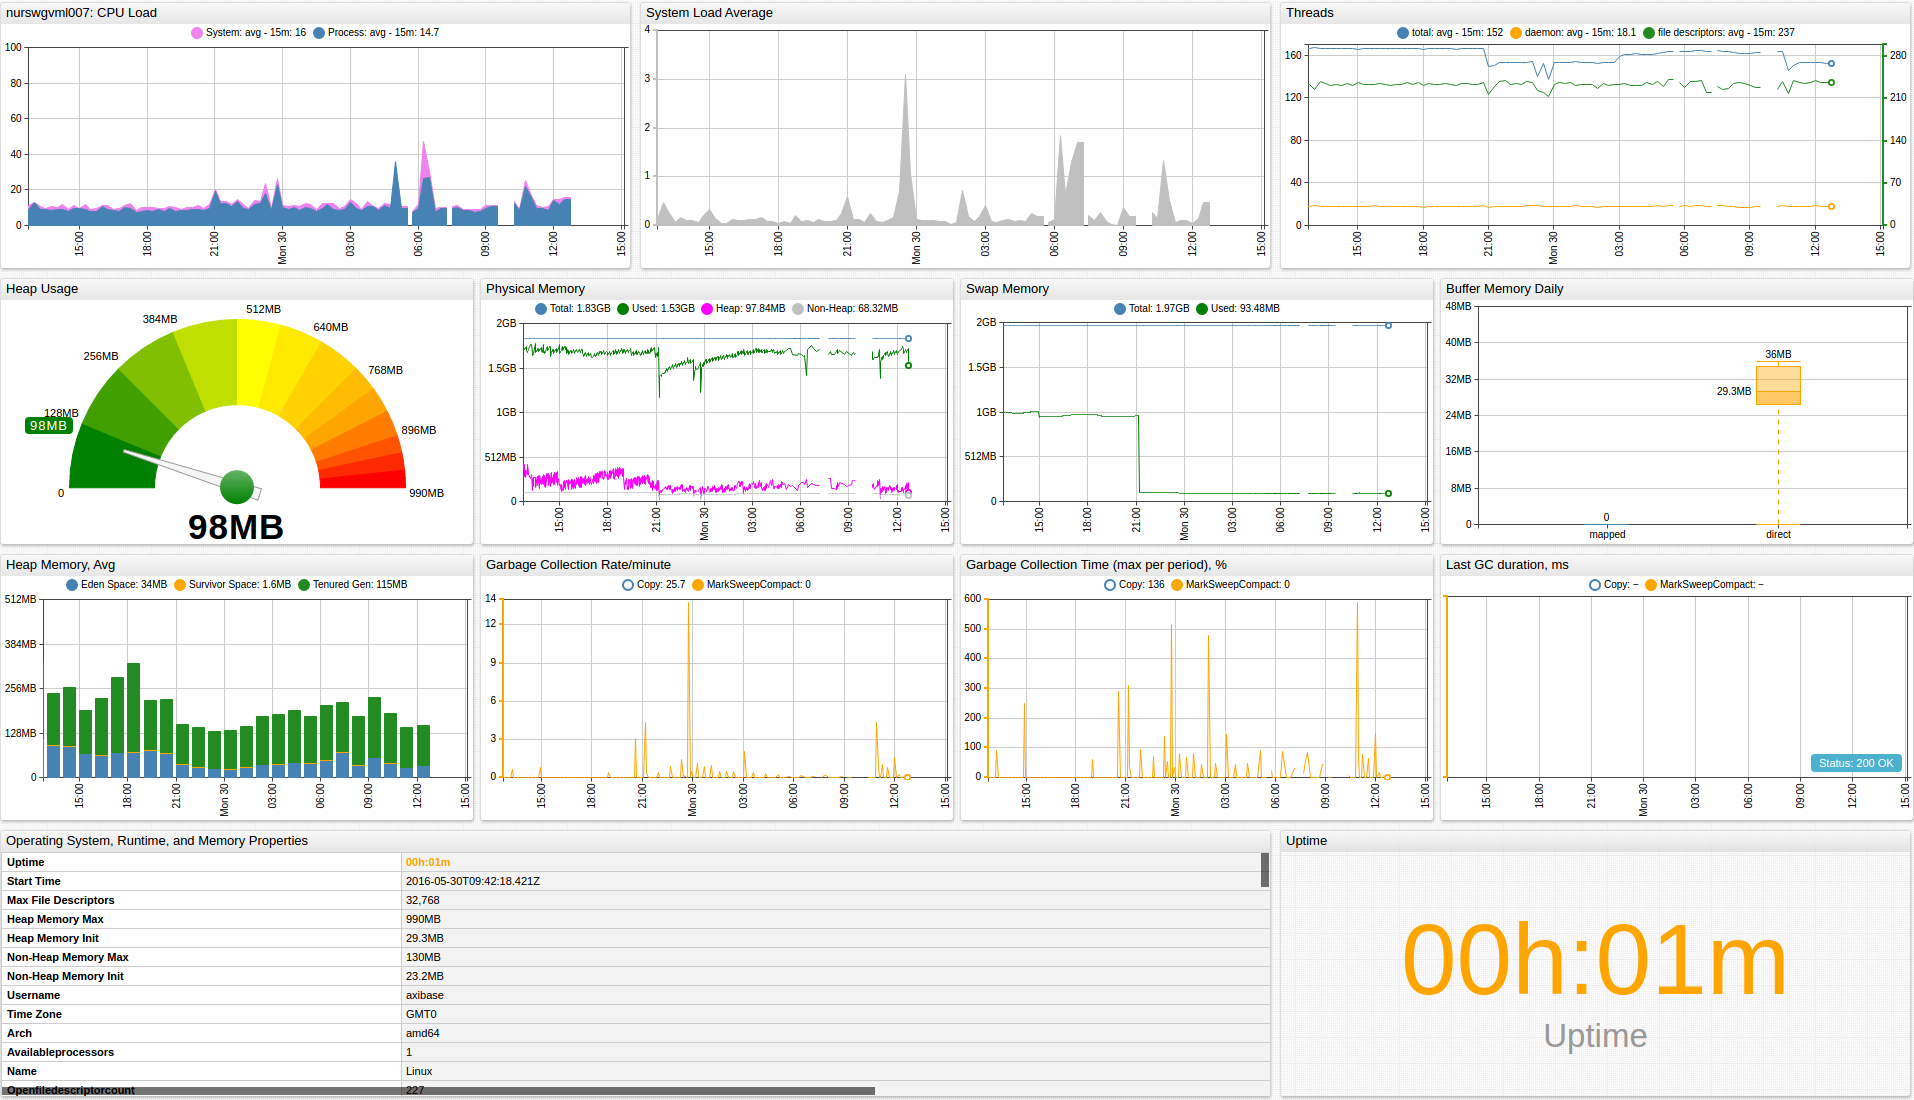
Portal
- Open the Portals menu and select Configure, click Import, and upload
jvm_portal.xml. - Click the Assign link and associate the portal with the entity group you created earlier.
- Open the Entity tab, find the java application by name, and click the Portal icon:
![]()
Rules
Setting up Mail Client
- Configure Mail Client.
Import Rules
- Open the Alerts menu and select Rules, click Import, and upload
jvm_rules.xml. - For each created rule: open the rule in the Rule Editor and change recipient address on the Email Notifications tab.
- These rules automatically apply to all JVM-based applications monitored by Axibase Collector.
Imported rules:
| Rule | Description |
|---|---|
jvm_application_restart | Raise an alert when an application has been restarted less than 5 minutes ago. |
jvm_cpu_load | Raise an alert when an application cpu load exceeds the set threshold. |
jvm_garbage_collection_rate | Raise an alert when an application Garbage Collector rate exceeds the set threshold. |
jvm_garbage_collection_time | Raise an alert when an application Garbage Collector time exceeds the set threshold. |
jvm_heap_memory_usage | Raise an alert when an application heap memory usage exceeds the set threshold. |
jvm_runtime_property_changed | Raise an alert when an application property is changed. |
jvm_system_load | Raise an alert when an application system load exceeds the set threshold. |
To create your own rules, refer to Rule Engine documentation.