
nginx PLUS Web Server Monitoring
Overview
This document describes how to collect various metrics from an nginx PLUS web server for long-term retention and monitoring in Axibase Time Series Database.
You can organize the periodic data collection in several ways:
- Configuring Axibase Collector JSON job to periodically poll server's status page and upload obtained data for parsing in ATSD.
- Using
axibase_nginx_plus_collectorpython script along with an OS scheduler. This method is described onaxibase_nginx_plus_collector.
The document contains instructions for the first method of configuration.
Requirements
- NGINX PLUS server with
ngx_http_status_moduleenabled. - Axibase Collector for scheduled polling of the NGINX status page.
- Axibase Time Series Database as a centralized data repository.
Configure a job in Axibase Collector
Axibase Collector polls the nginx PLUS status page every 5 seconds, build network commands, and send commands to ATSD.
Log in to Axibase Collector web interface.
Create Item List for nginx PLUS servers
- Open the Collections > Item Lists page.
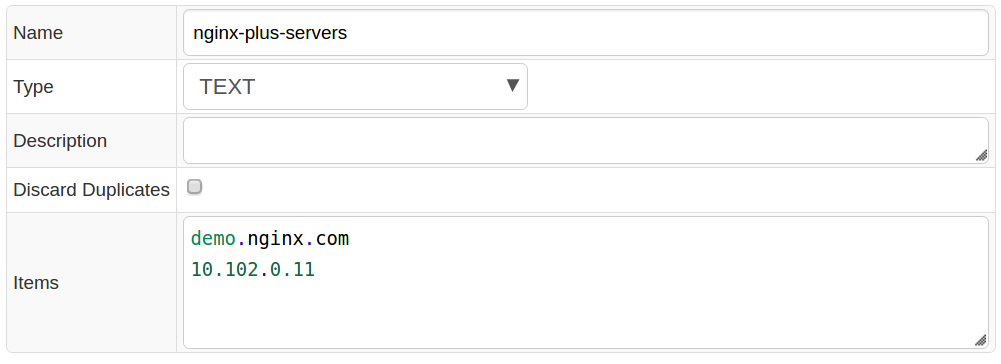
- Add a new TEXT Item List named
nginx-plus-serverscontaining DNS names or IP addresses of the monitored nginx PLUS servers, one server per line. Ensure that each server on the list is accessible on the specified protocol and port and exposes the status page on the same path/status. If the protocols and ports are different, move the entire URL to the list and set Path field equal to the${ITEM}placeholder. - Click Save.
Import a Job
- Import the
nginx-plus-collector-job.xmljob on the Jobs page by selecting Import from the split-button below the table. - Open the
nginx-plus-statisticsJSON job. - If the Storage drop-down is set to None, select the target ATSD server.
- Set Status to Enabled.
- Click Save.
The job consists of several settings blocks, each of which is responsible for processing specific data from the nginx PLUS status page. Each block forms special series and property commands for ATSD depending on what is being processed by the block. For example, the first settings block is responsible for processing general information about an nginx PLUS Server. This block fetches different metrics: connection, ssl handshakes, requests, respawned processses of the server and general properties such as address, nginx_version, load_timestamp, etc.
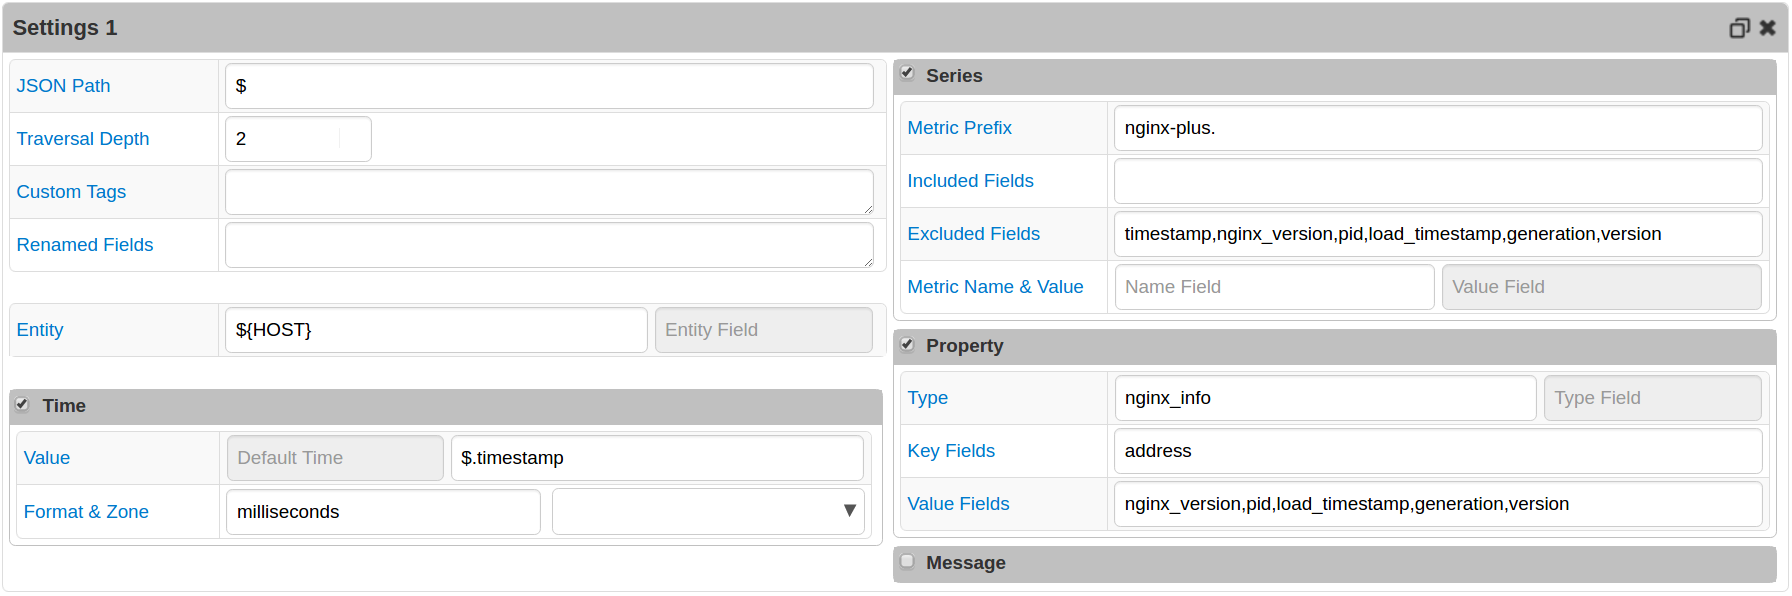
The result series and property commands formed by the block looks like this:
series e:demo.nginx.com d:2016-08-02T10:35:46.608Z m:nginx-plus.connections.accepted=40750818 m:nginx-plus.connections.dropped=0 m:nginx-plus.requests.current=11 m:nginx-plus.ssl.handshakes=45602 m:nginx-plus.connections.idle=34 m:nginx-plus.requests.total=85010375 m:nginx-plus.processes.respawned=0 m:nginx-plus.ssl.session_reuses=7504 m:nginx-plus.connections.active=11 m:nginx-plus.ssl.handshakes_failed=6641
property t:nginx_info e:demo.nginx.com d:2016-08-02T10:35:46.608Z k:address=198.51.100.1 v:nginx_version=1.9.13 v:pid=12121 v:load_timestamp=1469872800422 v:generation=17 v:version=6
Other settings blocks in the provided Collector Job Configuration File have the following characteristics:
- Second settings block collects information about all peers of upstreams and
stream.upstreams. - Third settings block collects all information about server zones and upstreams, along with general properties of all caches of the server.
- Fourth settings block is responsible for getting all information about
stream.server_zones. - Fifth settings block collects more detailed data about all the caches of the server.
Validate Data Availability
- Open the
nginx-plus-statusconfiguration in thenginx-plus-statisticsjob. - Click Test to verify processing.

- Log in to the ATSD web interface.
- Open the Metrics tab and apply the
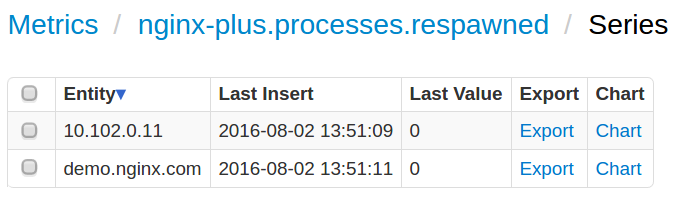
nginx-plus*name mask to view nginx metrics received by ATSD. - Click Series link and check that metrics are present for each server in the
nginx-plus-serverslist.
Viewing Data in ATSD
Metrics
List of collected nginx PLUS Server Metrics.
Entity Group
- Open the Settings menu and select Entity Groups, click Import, and upload
nginx_plus_entity_group.xml. - Select the imported
nginx-plus-serversgroup. - Verify that the group contains your nginx servers.
Portal
- Open the Portals menu and select Configure, click Import, and upload nginx-plus-portal.xml.
- Click the Assign link and associate the portal with the entity group created earlier.
- Open Entity tabs, find the nginx PLUS servers you want to see information about, and click the Portal icon.
 nginx PLUS Status portal example
Notifications
Monitor key nginx PLUS statistics by creating a rule in ATSD Rule Engine to send an email notification in case of abnormal conditions.
For example, send an email if the average active connections* count over the last 15 minutes on a target nginx PLUS server drops below the specified threshold.
Setting up Mail Client
- Configure Mail Client.
Import rules
- Download the Rules.
- Open the Alerts > Rules page.
- Click Import and attach the
nginx-plus-rules.xmlfile. - Open created rules in the Rule Editor and change recipient address on the Email Notifications tab.
- These rules automatically apply to all nginx PLUS servers monitored by Axibase Collector.
The following rules are provided in the nginx_plus_rules.xml file:
| Rule | Description |
|---|---|
nginx_plus_respawned_proc_increase | Raise an alert when an NGINX PLUS server's total number of abnormally terminated and respawned child processes increases. |
nginx_plus_fails_high | Raise an alert when an NGINX PLUS server's total number of unsuccessful attempts to communicate with some peer server is high. |
nginx_plus_dropped_high | Raise an alert when an NGINX PLUS server dropped sufficient amount of connections. |
nginx_plus_downtime_long | Raise an alert indicating NGINX PLUS server's peer is in "unavail" and "unhealthy" states during a specified period of time (default: 15 minutes). |
nginx_plus_active_connection_low | Raise an alert when an NGINX PLUS server average active connection count is below the specified threshold (default: 10) over the last 15 minutes. |
nginx_plus_active_connection_heartbeat | Raise an alert when status page statistics are no longer being received by ATSD. Check that the server is reachable and Axibase Collector job is running. |
To create your own rules, refer to Rule Engine Documentation.