
nginx Web Server Monitoring
Overview
This document describes how to collect connection and request metrics from an nginx web server for long-term retention and monitoring in Axibase Time Series Database.
The process involves enabling the nginx status page and configuring Axibase Collector to poll and upload this page every 5 seconds for parsing in ATSD.
Requirements
- nginx server with
ngx_http_stub_status_moduleenabled. - Axibase Collector for scheduled polling of the NGINX status page.
- Axibase Time Series Database as a centralized data repository.
nginx Server Configuration
Follow the steps outlined in the nginx Server Configuration Guide to enable metrics.
The status page returns connection statistics in an unstructured and malformed format, which is parsed by ATSD with RFC 7111 identifiers using whitespace as a separator.
Active connections: 291
server accepts handled requests
 16630948 16630948 31070465
Reading: 6 Writing: 179 Waiting: 106
select("#row=1").select("#col=3").
addSeries().
metric(cell(row, 1) + '_' + (cell(row,col-1)+'').substring(0,(cell(row,col-1)+'').length-1));
...
Import nginx CSV Parser Configuration into ATSD
- Log in to the ATSD web interface.
- Open the Data menu and select CSV Parsers page. Click Import.
- Import CSV parser for the nginx status page.
- The parser splits status page content into cells and assembles series commands from extracted cell values.
In addition, the parser creates a derived metricunhandled_percentequal to100*(1-handled/accepted).
Configure Jobs in Axibase Collector
Axibase Collector polls the nginx status page every 5 seconds and uploads the downloaded file into ATSD for parsing. Axibase Collector establishes a TCP connection with the same period to check availability of the server.
- Log in to Axibase Collector web interface
Create Item List for nginx servers
- Open the Collections > Item Lists page.
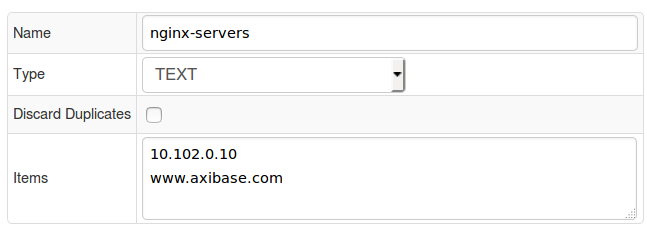
- Add a new TEXT Item List named nginx-servers, containing DNS names or IP addresses of the monitored nginx servers, one server per line. Ensure that each server on the list is accessible on the specified protocol and port and exposes the status page on the same path:
/nginx_status. If the protocols and ports are different, move the entire URL to the list and set the Path field equal to the${ITEM}placeholder. - Save the list.
Import Jobs
- Import the nginx-collector-jobs.xml job on the Jobs page by selecting Import from the split-button below the table.
- Open the
nginx-statisticsFILE job. - If the Storage drop-down is set to None, select the target ATSD server.
- Set Status to Enabled.
- Save the job.
- Open the
nginx-connect-checkTCP job. - If the Storage drop-down is set to None, select the target ATSD server.
- Set Status to Enabled.
- Save the job.
Validate Data Availability
- Open the
nginx-statusconfiguration in thenginx-statisticsjob. - Click Test to verify processing.

- Open the
nginx-connectconfiguration in thenginx-connect-checkjob. - Click Test to verify connectivity to the target server.
If TCP connection is successful, thetcp-connectmetric returns a 0 exit code.

- Log in to the ATSD web interface.
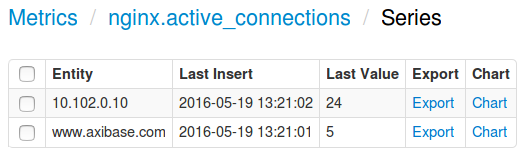
- Open the Metrics tab and apply the
nginx*name mask to viewnginxmetrics received by ATSD. - Click the Series link and check that metrics are present for each server in the nginx-servers list.
nginx Status Page Metrics
| Metric | Description |
|---|---|
| Active connection | The current number of active client connections, including Waiting connections. |
| Server accepts | The total number of accepted client connections. |
| Server handled | The total number of handled connections. The parameter is lower than Server accepts if the resource limits have been reached (for example, the worker_connections limit). |
| Server requests | The total number of client requests. |
| Reading | The current number of connections where nginx is reading the request header. |
| Writing | The current number of connections where nginx is writing the response back to the client. |
| Waiting | The current number of idle client connections waiting for a request. |
Viewing Data in ATSD
Metrics
List of collected nginx server metrics.
Entity Group
- Open Settings > Entity Groups, click Import, and upload nginx_basic_entity_group.xml.
- Select imported
nginx-serversgroup. - Verify that the group contains your nginx servers.
Portal
- Open the Portals page, click Import, and upload
nginx_portal.xml. - Click the Assign link and associate the portal with the entity group you created earlier.
- Open the Entity tab, find the nginx servers you want to see information about, and click the Portal icon.
 Basic nginx Status portal example
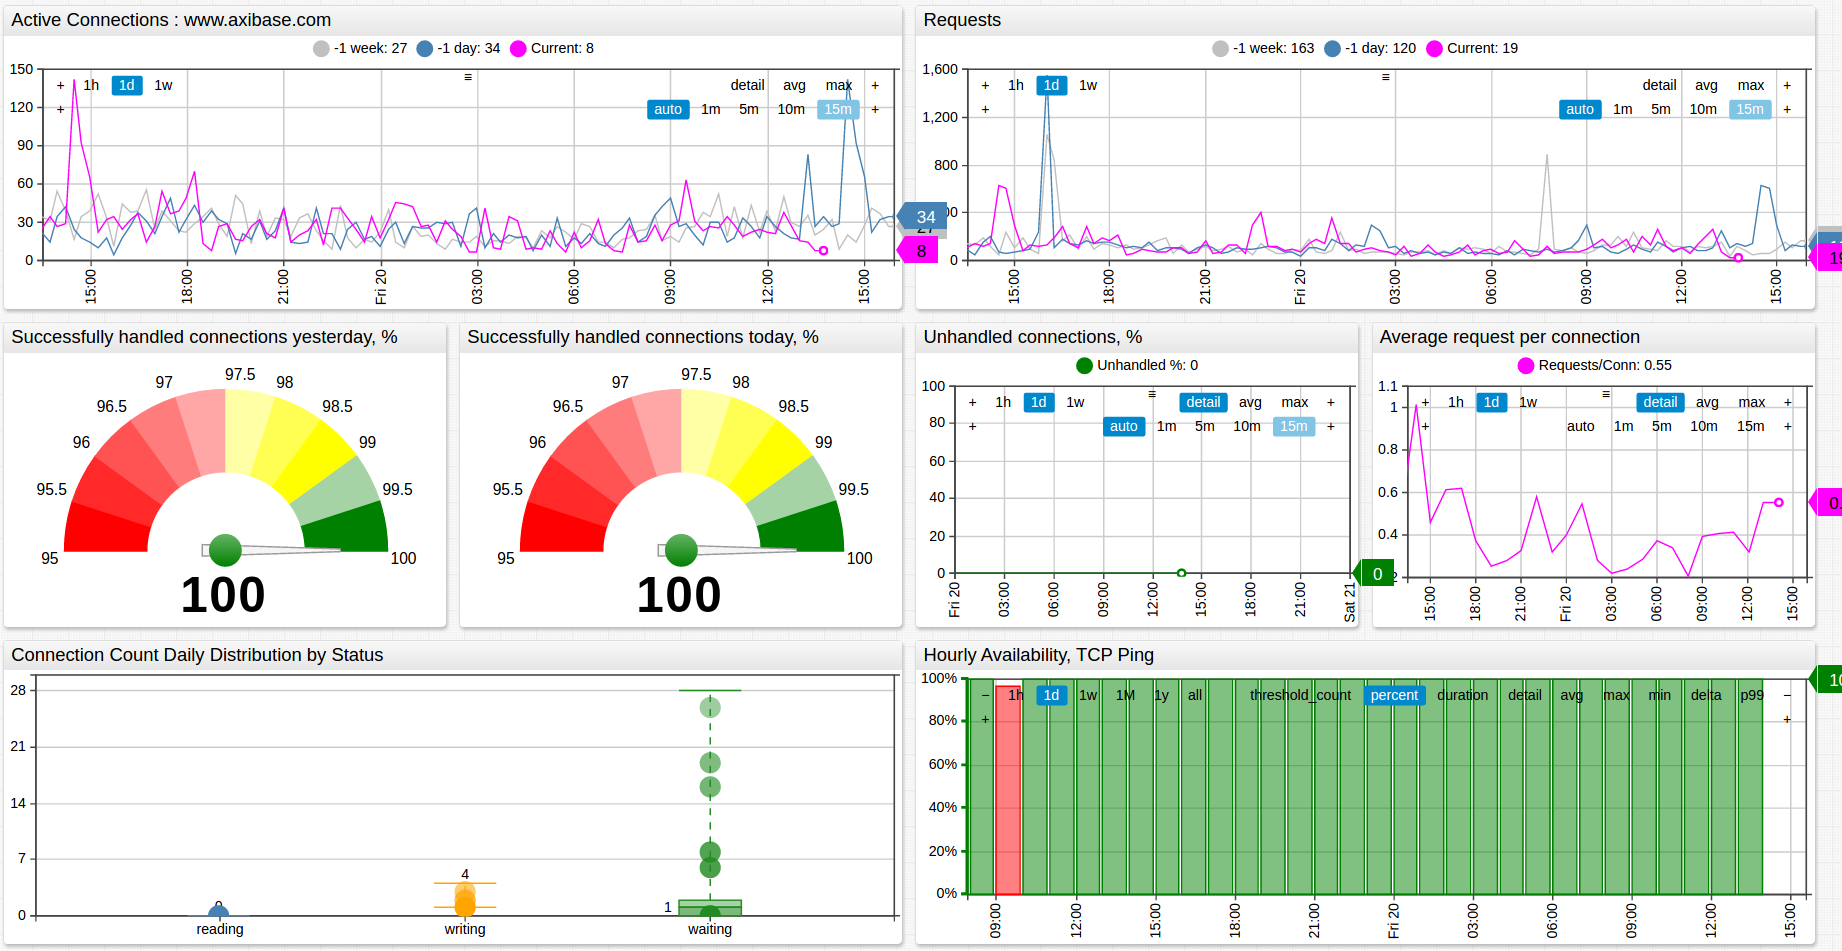
Notifications
Monitor key nginx statistics by creating a rule in ATSD rule engine to send an email notification in case of abnormal conditions.
For example, you can send an email if the average Active Connections count over the last 15 minutes on a target nginx server drops below the specified threshold.
Setting up Mail Client
- Configure Mail Client.
Import rules
- Download the nginx Notification Rule.
- Open the Alerts menu and select Rules.
- Click Import and attach the
nginx_notification_rules.xmlfile. - Open created rules in the Rule Editor and change the recipient address on the Email Notifications tab.
- These rules automatically apply to all nginx servers monitored by Axibase Collector.
The following rules are provided in the nginx_notification_rules.xml file:
| Rule | Description |
|---|---|
nginx_unhandled_percent_high | Raise an alert when an nginx server unhandled connection percentage is above 2%. |
nginx_active_connections_low | Raise an alert when an nginx server average Active Connection count is below 10 over the last 15 minutes. |
nginx_active_connections_heartbeat | Raise an alert when status page statistics are no longer being received by ATSD. Check that the server is reachable and Axibase Collector job is running. |
nginx_tcp_heartbeat | Raise an alert when the TCP connect metric is no longer being received by ATSD or if the TCP connect metric contains error codes. Check that the server is reachable and Axibase Collector job is running. |
To create your own rules, refer to Rule Engine documentation.