Treemap Widget
Overview
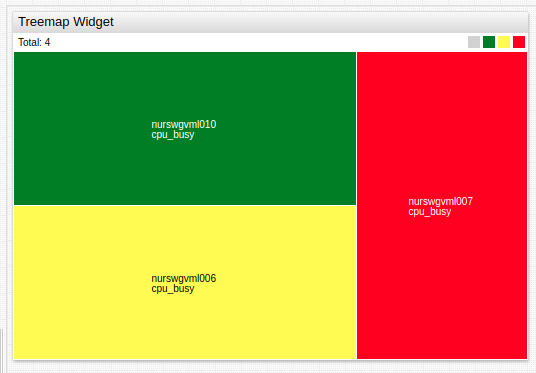
The Treemap Widget displays each series as a colored rectangle according to the magnitude of series value deviation from the threshold.
[widget]
  type = treemap
  entity = nurswgvml0*
  colors = green, yellow, red
  thresholds = 0, 10, 25, 50

  [series]
    metric = cpu_busy

Widget Settings
- The settings apply to the
[widget]section. - Common
[widget]settings are inherited.
| Name | Description | |
|---|---|---|
mode | Widget layout mode. Possible values: row - Align rectangles as rows.column - Align rectangles as columns.auto - Switch between row and column modes depending on widget size.Example: mode = row | ↗ |
display-total | Display the sum of rectangle sizes in widget header. Possible values: false, true.Default value: true.Example: display-total = false | ↗ |
size-name | Title when display-total = true.Specified size-name value is displayed after default title Total.Example: size-name = Value | ↗ |
format-size | Total value format.Refer to Format Settings for possible values. Example: format-size = kilobytes | ↗ |
font-size | Widget font size. All text, except widget header is affected. Default value: 10.Example: font-size = 15 | ↗ |
color-range | Color palette applied to threshold areas. Possible values: red, blue, black.Example: color-range = red | ↗ |
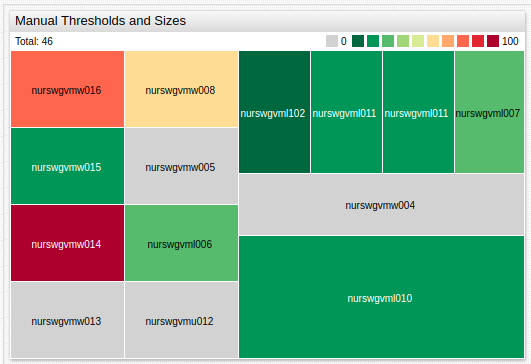
colors | Comma separated list of color names or hex codes, assigned to threshold areas. The number must be 1 fewer than the number of thresholds.Example: colors = green, yellow, redRecommended color palette tools: colorhexa, material.io. | ↗ |
thresholds | Threshold values. The number of specified colors must be 1 fewer than the number of thresholds.Example: thresholds = 0, 25, 50, 75, 100 | ↗ |
gradient-count | Number of gradients within each threshold rectangle. Example: gradient-count = 3 | ↗ |
total-size | Maximum size of all rectangles combined. If total-size is greater than combined size of all rectangles, additional space is filled white.Example: total-size = 5 | ↗ |
palette-ticks | Show legend labels. Possible values: false, true.Default Value: false.Example: palette-ticks = true | ↗ |
rotate-palette-ticks | Rotate legend labels. Possible values: false (horizontal), true (vertical).Default value: false.Example: rotate-palette-ticks = true | ↗ |
range-merge | If thresholds is not defined, a different set of ranges is computed for each series based on observed min and max values within the loaded timespan.range-merge computes a single set of ranges for all series in the widget with min and max for all loaded series.Possible values: false, true.Default value: false.Example: range-merge = true | ↗ |
Series Settings
- The settings apply to the
[series]section. - Common
[series]settings are inherited.
| Name | Description | |
|---|---|---|
size | Relative rectangle size. Possible values: Number, value, value('alias').Default value: 1.Examples:
| ↗ |
Other Settings
- The settings apply to the
[other]section. - Specifying the
[other]section creates an additional rectangle not associated with any series which displays a value or spare capacity.
| Name | Description | |
|---|---|---|
size | Relative rectangle size. Possible values: Number, value, value('alias').Default value: 1.Examples:
| ↗ |
label | Rectangle label. Example: label = Total Capacity | ↗ |
color | [other] section color.Default value: grey.Example: color = black | ↗ |
Properties Settings
- The settings apply to the
[properties]section. - In
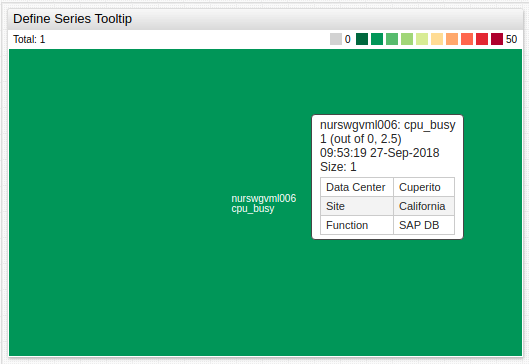
[series]or[other]section, define properties displayed on mouseover. - If a value contains
=or\, escape the characters, for example\=or\\, respectively.
[properties]
  Data Center = Cuperito
  Site = California
  Function = SAP DB
Examples
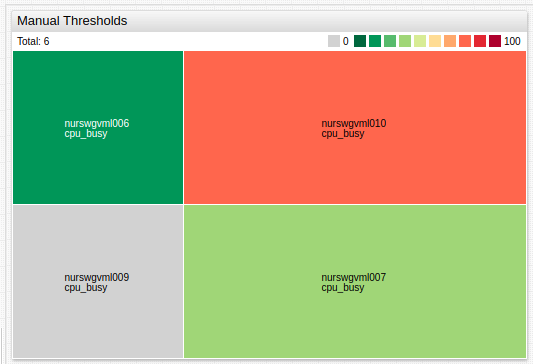
Manual Thresholds
Advanced Configuration Example