Portal Performance Diagnostics
Overview
These instructions outline steps required to record JavaScript timelines and resource usage in ATSD portals.
Google Chrome
Capturing Performance Profile
Open an ATSD portal.
Click
F12on Windows orCommand+Option+Ion Mac to open Developer Tools.Open the Performance panel.
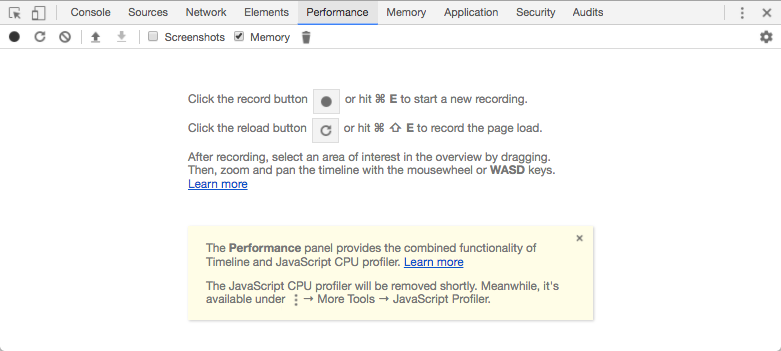
Click Record
 in the top left bar to initiate a profiling session.
Execute the steps that typically cause performance issues such as loading the page, opening a dialog chart, or opening controls.
Click Stop to discontinue recording the session.
Click the Down Arrow
 in the top toolbar to save profile to a JSON file
Capturing Memory Profile
Open an ATSD portal.
Click
F12on Windows orCommand+Option+Ion Mac to open Developer Tools.Open the Memory panel.
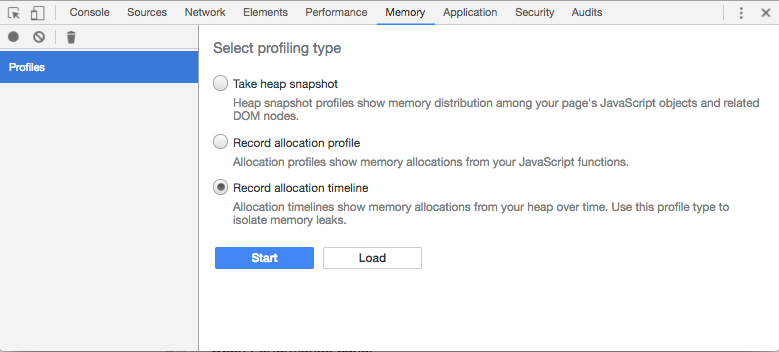
Click Record allocation timeline button.
Click Start.
Execute the steps that typically cause performance issues such as loading the page, opening a dialog chart, or opening controls.
Click the red Record circle
 to stop recording the session.
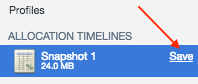
Click Save to save profile to a
heaptimelinefile.