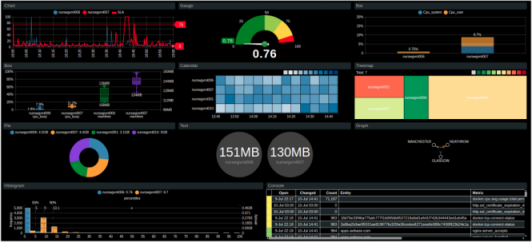
Introduction
Axibase Charts is a graphics library for visualizing time series.
The library provides a simple configuration syntax to build dashboards from widgets.
[widget]
  type = chart
  [series]
    entity = nurswgvml007
    metric = cpu_busy
Powerful Syntax
- Aligned with ATSD time series schema for quick results.
- Create derived series.
- Join irregular series.
- Re-compute aggregates on the fly.
- Utilize imperative constructs such as variable assignment, conditional branching, and loops for automation.
var servers = getEntities('my-app-group')
for server in servers
  [series]
    entity = @{server}
    metric = page_count
endfor
Historical and Streaming Data
- Incremental real-time data loading.
- Streaming parsing of compressed historical data.
Development Tools
Sandbox Apps
Plugins
The Axibase Charts plugin for the Microsoft VSCode editor is a design tool that simplifies portal development and data exploration.
The plugin implements the following functionality:
- Syntax Validation
- Syntax Highlighting
- Settings Reference
- Live Preview
- Code Formatting
- Auto-completion
Sample Apps
Widgets
| Time Chart | Gauge Chart | Bar Chart |
|---|---|---|
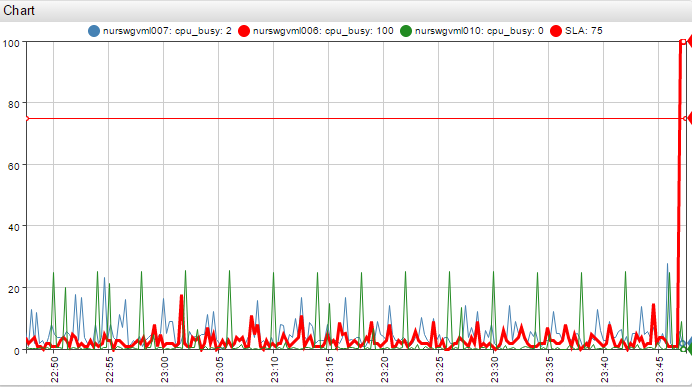 | 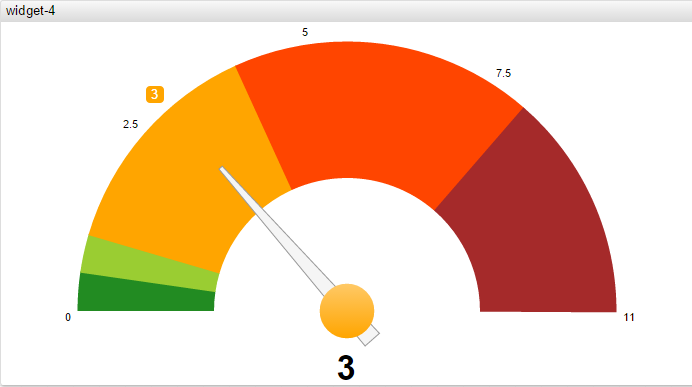 | 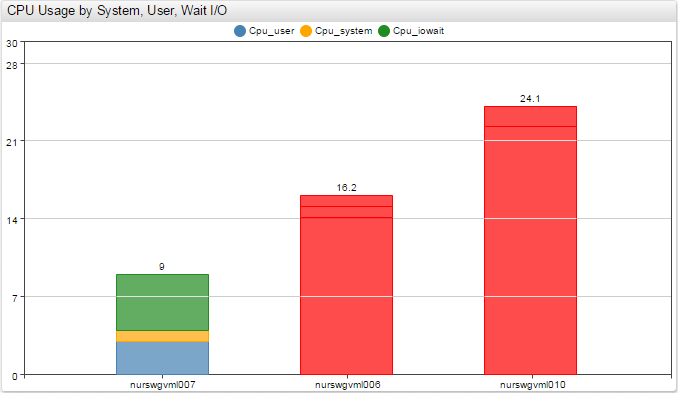 |
| Histogram Chart | Box Chart | Calendar Chart |
|---|---|---|
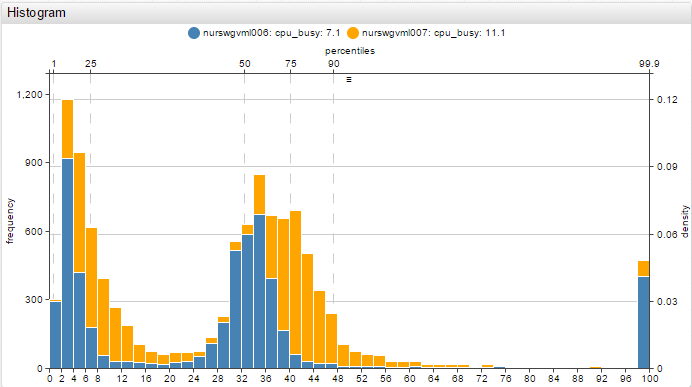 | 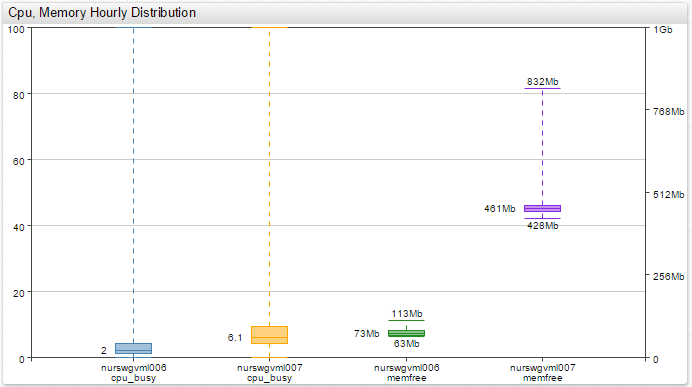 | 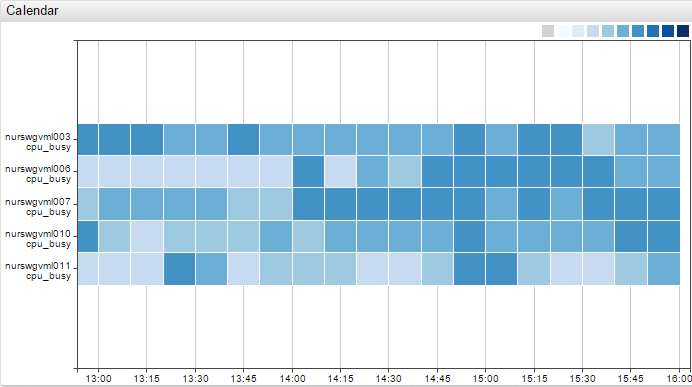 |
| Treemap Widget | Pie Chart | Graph Widget |
|---|---|---|
 | 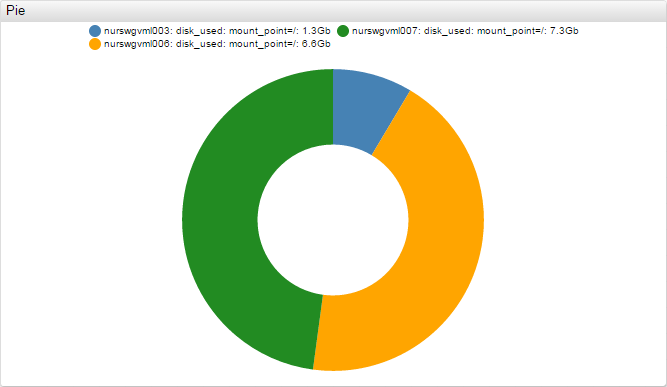 | 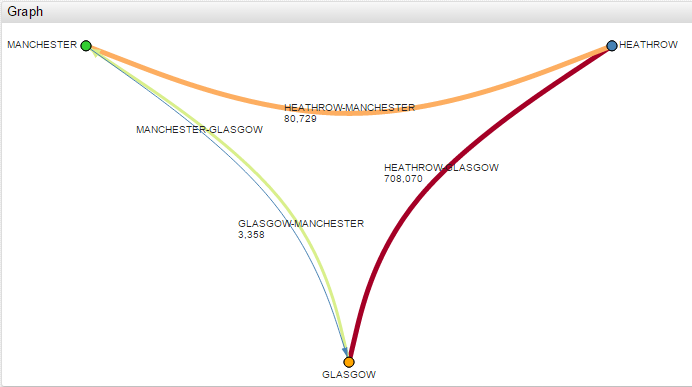 |
| Text Widget | Page Widget | Alert Table |
|---|---|---|
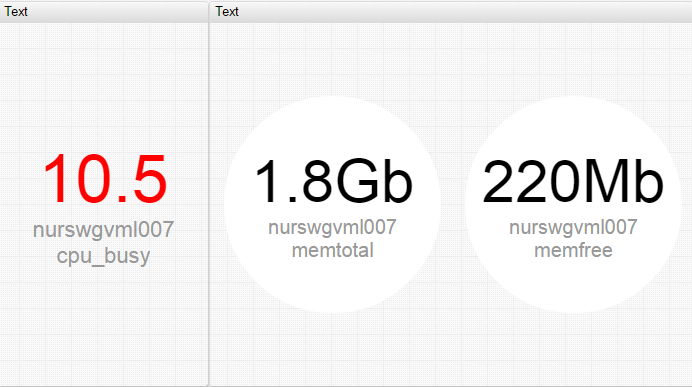 | 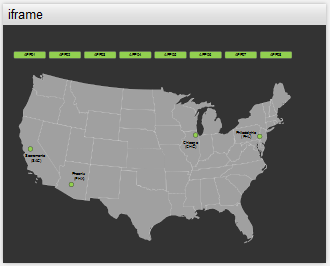 | 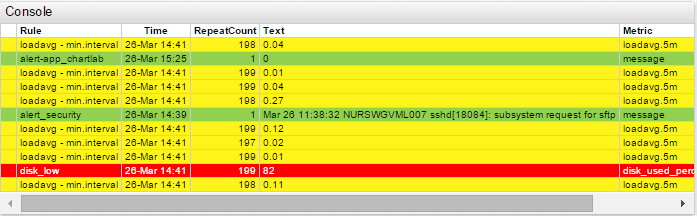 |
| Series Table | Property Table |
|---|---|
 |  |
Supported Browsers
Google Chrome 48+Firefox 44+Microsoft Edge 14+Internet Explorer 11