Common Settings
Overview
The Common Settings are shared settings supported by all widgets.
Widget Settings
- The settings apply to the
[widget]section.
| Name | Description | |
|---|---|---|
type | Widget visualization type: chart, gauge, bar, histogram, box, calendar, treemap, pie, console, property, text, page, graph.Example: type = chart | ↗ |
title | Title displayed above chart. HTML Markup is supported. Example: title = CPU Usage Statistics | ↗ |
on-title-click | Action, executed on title click. Available arguments: • widget - object, corresponding to current widget• config - object, representing parsed configuration• next - callback, representing default action.Default value: next().Example: on-title-click = widget.reload() | ↗ |
tooltip | Widget description displayed on title mouseover. Example: tooltip = CPU Usage | ↗ |
style | Widget CSS style. Example: style = background-color: skyblue | ↗ |
header-style | Widget header CSS style. Example: header-style = color: red | ↗ |
colors | Comma separated list of colors applied to series shapes: lines, rectangles, or circles, depending on the widget type. Possible values: color names or hex codes. Default values: steelblue, orange, forestgreen, blueviolet, maroon, yellowgreen, magenta, chocolate, deepskyblue, gray.Additional series are assigned colors at random. Example: colors = green, #cccccc.Recommended color picking tools: colorhexa, material.io, web colors. | ↗ |
Position and Size
| Name | Description | |
|---|---|---|
width-units | Number of columns the widget occupies. Default value: 1.Example: width-units = 0.5 | ↗ |
height-units | Number of rows the widget occupies. Default value: 1.Example: height-units = 2 | ↗ |
top-units | Widget offset, in units, from the top page border. Default value is equal to the ordinal number of its [group] section.Example: top-units = 2 | ↗ |
left-units | Widget offset, in units, from the left page border. Default value is equal to the ordinal number of the widget within the [group].Example: left-units = 2 | ↗ |
position | Defines cells on the grid where widget must be located. Example: position = 2-2, 2-1.7 | ↗ |
See also Layout Settings that determine the total number of columns and rows in a grid placement.
Date Filter
| Name | Description | |
|---|---|---|
timespan | Time interval for loading historical data, measured in time units. Format: count unit, for example 1 day.The end of the timespan is set to current browser time, unless start-time or end-time setting is specified.timespan = all retrieves all data.Default value is 1 hour except for the alert table where timespan is set to all.Example: timespan = 6 hour | ↗ |
start-time | Start of the time interval, specified as Date Expression. Example: start-time = current_hour | ↗ |
end-time | End of time interval, specified as Date Expression. If start-time is set, the end time is calculated as start time plus the timespan.end-time is set to now if start-time is not specified.Example: end-time = 2018-07-05T13:00:00Z | ↗ |
timezone | Time Zone ID, in which start-time and end-time are evaluated. The settings also applies to dates printed on the time axis and sample legends.Default value: local (browser time zone).Example: timezone = Europe/Vienna | ↗ |
time-offset | Time series offset specified as the number of time units.time-offset > 0: Offset into the past.time-offset < 0: Offset into the future.Format: count time_unit.Example: time-offset = 3 month | ↗ |
Last Insert Filter
The filter selects entire series based on the timestamp of the most recent sample.
| Name | Description | |
|---|---|---|
min-insert-time | Include series if the timestamp of the latest sample is equal or greater than min-insert-time, specified as Date Expression.Example: min-insert-time = current_hour | ↗ |
max-insert-time | Include series if the timestamp of the latest sample is less than max-insert-time, specified as Date Expression.Example: max-insert-time = previous_hour | ↗ |
Data Loading
| Name | Description | |
|---|---|---|
series-limit | Maximum number of series retrieved from the database. Default value: 1000.Example: series-limit = 10 | ↗ |
limit | Maximum number of samples retrieved for each returned series. Default value: 0 (not limited).Example: limit = 100 | ↗ |
cache | Query last values from the cache table for faster response. Possible values: false, true.Default value: false.Example: cache = true | ↗ |
add-meta | Include metric and entity metadata in the response. Possible values: false, true.Default value: false.Example: add-meta = true | ↗ |
filter | Boolean expression (sampleFilter) applied to detailed samples. Samples that satisfy the condition are included in the result. Note that literal dates are evaluated in the server time zone.Examples: filter = value > 1filter = date.timeOfDay > '07:00' | ↗ |
See also Control fields in REST API.
Data Update
| Name | Description | |
|---|---|---|
update-interval | Interval for loading incremental data specified as the number of time units. Format: count time_unit.Default value: 1 minute.Example: update-interval = 5 minute | ↗ |
refresh-interval | Interval for including the series into the update request to load incremental data. While the setting has no effect on the update frequency, set with update-interval, it controls which series are included in the request.The interval is specified as the number of time units. Format: count time_unit.Example: refresh-interval = 5 minute | ↗ |
retry-refresh-interval | Interval for including empty series into the update request to load incremental data. Empty series contain no data. The setting has no effect on the update frequency, set with update-interval, however it controls which series are included in the request.The interval is specified as the number of time units. Format: count time_unit.Example: retry-refresh-interval = 5 minute | ↗ |
error-refresh-interval | Interval for including failed series into the update request to load incremental data. Failed series are series for which a request to load data from server produced an error. The setting has no effect on the update frequency, set with update-interval, however it controls which series are included in the request.The interval is specified as the number of time units. Format: count time_unit.Example: error-refresh-interval = 30 minute | ↗ |
batch-update | Send data queries to the server in batches with size specified in batch-size setting.Possible values: false, true.If true, series for which the request has failed are requested separately from successfully updated series.Default value: false.Example: batch-update = true | ↗ |
batch-size | Maximum number of series per server batch request. If 0 is specified, the limit is not set and all series are requested in one query.Valid when batch-update = true.Default value: 8.Example: batch-size = 1 | ↗ |
fix-start-time | If true, original start date is used in incremental requests. The loading interval becomes expanding, not sliding.Default value: false | ↗ |
See also Data API Endpoints in REST API.
Data Source
| Name | Description | |
|---|---|---|
url | Server URL, if different from the origin host. URL for data requests is built from {url}{context-path}{method-path}{url-parameters}.Example: url = https://atsd.example.org:8443 | ↗ |
context-path | Context path for data requests. Default value: /api/v1/.Example: context-path = /api/v2/ | ↗ |
path | REST API method path. Default value is specific for each data type: /series/query, /properties/query, /messages/query, /alerts/query.Example: path = /series/query | ↗ |
url-parameters | Optional request parameters included in data requests. Parameter names and values must be URL-encoded and separated by &.? at the beginning of the query is optional.Example: url-parameters = db=1 | ↗ |
Legend
| Name | Description | |
|---|---|---|
legend-position | Legend location. Possible values: hidden, top, right, bottom, leftDefault value: hidden for a single series, top for multiple series.Combine values to define corners. Example: legend-position = left | ↗ |
Axis
| Name | Description | |
|---|---|---|
axis-title | Vertical text displayed along the left axis. Example: axis-title = CPU Utilization in % | ↗ |
axis-title-right | Vertical text displayed along the right axis. Example: axis-title-right = Free Memory | ↗ |
day-format | Time axis format. Example: day-format = %Y/%m/%d | ↗ |
min-range | Left axis minimum range. If loaded values exceed min-range value, axis range is adjusted to show loaded values.Example: min-range = 0 | ↗ |
max-range | Left axis maximum range. If loaded values exceed max-range value, axis range is adjusted to show loaded values.Example: max-range = 100 | ↗ |
min-range-right | Right axis minimum range. If loaded values exceed min-range-right value, right axis range is adjusted to show loaded data.Example: min-range-right = 0 | ↗ |
max-range-right | Right axis maximum range. If loaded values exceed max-range-right value, right axis range is adjusted to show loaded data.Example: max-range-right = 100 | ↗ |
max-range-force | Left axis forced minimum and maximum range. If loaded values exceed max-range-force, axis range is not adjusted to show loaded values.max-range-force must be equal or exceed max-range.Example: max-range-force = 100 | ↗ |
min-range-force | Left axis forced minimum and maximum range. If loaded values exceed min-range-force, axis range is not adjusted to show loaded values.Example: min-range-force = 0 | ↗ |
min-range-right-force | Right axis forced minimum range. If loaded values exceed min-range-right-force, right axis range is not adjusted to show loaded values.Example: min-range-right-force = 0 | ↗ |
max-range-right-force | Right axis forced maximum range. If loaded values exceed max-range-right-force, right axis range is not adjusted to show loaded values.Example: max-range-right-force = 100 | ↗ |
Difference between range settings.
*-rangesettings specify the minimum and maximum value displayed on the axis.*-range-forcesettings set the thresholds for hiding values outside of the range.
Series Settings
- The settings apply to the
[series]section.
Series Selection
| Name | Description | |
|---|---|---|
metric | Metric name. When requesting data from a relational database specify both table and attribute as an alternative.Example: metric = cpu_busy | ↗ |
table | Table in the relational database from which to retrieve numeric values. Alternative to metric setting.Both table and attribute must be defined.Example: table = KLZ_CPU | ↗ |
attribute | Column name in a relational database table. The column must be of numeric data type. Example: attribute = Current_Average | ↗ |
data-type | Series data type. Possible values: history, forecast, forecast_deviation, lower_confidence, upper_confidence.Example: data-type = forecast | ↗ |
forecast-name | Forecast name when data-type setting is set to forecast, forecast_deviation, lower_confidence, upper_confidence.If no forecast name is specified, the default series forecast is loaded. Example: forecast-name = hw5 | ↗ |
Entity Filter
| Name | Description | |
|---|---|---|
entity | Entity name. Supports ? and * wildcards.Example: entity = nurswgvml007 | ↗ |
entities | Select multiple entities with one setting. If both entity and entities are specified, entity takes precedence.Supports ? and * wildcards.Example: entities = nurswgvml007, nurswgvml008 | ↗ |
entity-group | Entity group name. Example: entity-group = nmon-sub-group | ↗ |
entity-expression | Server-side entity filter to select series for matching entities by name, tags, and fields. Refer to Entity Filter REST API documentation for more information. Example: entity-expression = tags.app LIKE '*a*' | ↗ |
Tag Filter
To select series with specific tags, add a [tags] section or define a condition using the tag-expression setting.
[series]
  metric = disk_used
  entity = nurswgvml007
  [tags]
    mount_point = /tmp
    fstype = tmpfs
To match multiple values for the same tag, separate the values with a comma. Escape commas if necessary using backslash.
[tags]
  tag_name = tag_value1, tag\,value
To match multiple tag values, use ? and * wildcards:
[tags]
  tag_name = *val*
If the tag name contains an equals sign =, a comma,, or reserved names such as setting names, enclose the tag name in double quotes to avoid collisions:
[tags]
  "type" = sensor
  "tag\=name" = tag\,value
| Name | Description | |
|---|---|---|
tag-expression | Server-side tag filter to select series for matching tags. Example: tag-expression = tags.make LIKE 'AU*' | ↗ |
exact-match | Ignore series with tags other than those specified in the [tags] section.Default value: false.Example: exact-match = true | ↗ |
SQL
| Name | Description | |
|---|---|---|
sql | SQL query. Can be specified as sql/endsql block or as multiple sql= settings. If specified, context-path is set to /api/sql/, path is set to series and url-parameters are set to ?q=${sql}&timeFormat=milliseconds.Example: sql | ↗ |
Legend
| Name | Description | |
|---|---|---|
label-format | Series label pattern consisting of literal text and placeholders. Example: label-format = entity | ↗ |
Series Style
| Name | Description | |
|---|---|---|
color | Color applied to series shape. Possible value: color name or hex code. Default values: steelblue, orange, green, purple, maroon, yellowgreen, hotpink, chocolate, deepskyblue.Additional series are assigned colors at random. Example: color = blueRecommended color picking tools: colorhexa, material.io. | ↗ |
label | Series label displayed in the legend. Overrides label-format.Example: label = CPU Busy - nurswgvml007 | ↗ |
style | CSS style applied to the series shape. Example: style = stroke-width: 4style = stroke-dasharray: 5 1 2 | ↗ |
tooltip | Tooltips displayed on mouseover. Example: tooltip = NURSWGVML007 | ↗ |
axis | Series axis placement. Possible values: left, right.Default value: left.Example: axis = right | ↗ |
format | Format series values with a measurement unit. Example: format = kilobytes | ↗ |
display | Hide series based on boolean value or expression. Supported fields: value, previous, time, value and ranking functions.Example: display = value > 100display = max('1 hour') > 50display = value >= top(3)display = falsedisplay = !isNaN(value)display = time < new Date().getTime() - 60*60000*24display = this.lastRequestTime - this.last.t < 60000display = tags.location != 'SVL'display = +meta().entity.tags["capacity"] > 100 | ↗ |
enabled | Toggle series visibility. Same as the display setting except that the disabled series legend remains visible.Example: enabled = false | ↗ |
alert-expression | Boolean expression to apply conditional CSS style to series shapes. The CSS style must be specified in the alert-style setting.The value field refers to the series value.Example: alert-expression = value < 95 | ↗ |
alert-style | CSS style applied to the series shape if alert-expression returns true.Example: alert-style = fill: red; stroke: red | ↗ |
audio-alert | Boolean expression to apply conditional CSS style to series shapes. Example: audio-alert = /portal/resource/alarm.ogg | ↗ |
Transformation
Transformation Order
| Name | Description | |
|---|---|---|
transformation-order | transformation-order controls the sequence of data modification procedures.Default sequence: interpolate, group, rate, aggregate, smooth, downsample, forecast, none.Example: transformation-order = downsample, aggregate.Default value: none. If set to none, the default sequence is used.If specified, the server-aggregate setting is set to true by default. | ↗ |
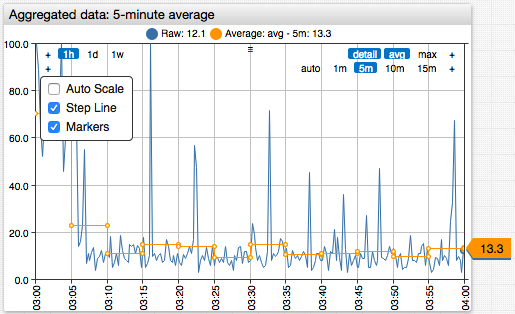
Aggregation
Aggregation splits the underlying series into periods of equal duration and applies statistical functions to values in each period. The derived series is regular and has fewer samples.
[series]
  statistics = avg
  period = 5 minute

| Name | Description | |
|---|---|---|
server-aggregate | Forces aggregation on server side. Default value: false.Example: server-aggregate = true | ↗ |
statistics | Statistical function applied to values in each period. Example: statistics = avg | ↗ |
period | Repeating time interval to split the timespan, specified as the number of time units. Possible values: count time_unit or auto.Example: period = 15 minute | ↗ |
align | Alignment of the period start or end time. Possible values: CALENDAR, START_TIME, END_TIME, FIRST_VALUE_TIME.Default value: CALENDAR.Example: align = END_TIME | ↗ |
interpolate | Add missing aggregation periods. Possible values: NONE, LINEAR, PREVIOUS, NEXT, VALUE(n), where n is the numerical value to be used to fill missing samples.Default value: NONE.Example: interpolate = LINEAR | ↗ |
interpolate-extend | Interpolate leading and trailing periods with NEXT or PREVIOUS value.Example: interpolate-extend = true | ↗ |
start-working-minutes | Working date start time, in minutes. If working day starts at 9:30 then start can be specified as 570 = 9 * 60 + 30.Applied only if statistic is one of THRESHOLD_* functions. Example: start-working-minutes = 570 | ↗ |
end-working-minutes | Working date end time, in minutes. If working day ends at 12:30 then end can be specified as 750 = 12 * 60 + 30.Applied only if statistic is one of THRESHOLD_* functions. Example: end-working-minutes = 750 | ↗ |
See also Aggregation transformation in REST API.
Interpolation
| Name | Description | |
|---|---|---|
interpolate-function | Interpolation function applied to detailed samples. Possible values: NONE, LINEAR, PREVIOUS, NEXT, VALUE(n), where n is the numerical value to be used to fill missing samples.Default value: NONE.Example: interpolate-function = linear | ↗ |
interpolate-period | Interpolation period specified as the number of time units. Format: count time_unit.Example: interpolate-period = 1 minute | ↗ |
interpolate-boundary | Interpolation for leading and trailing values. Possible values: inner- Data outside of the selection interval is not loaded by the database. outer- One value before and one value after the selection interval is loaded by the database to interpolate leading and trailing values.Default value: inner.Example: interpolate-boundary = outer | ↗ |
interpolation-fill | Interpolate values outside of the selection interval. Possible values: false, true, count of values to fill.Default value: false.Example: interpolate-fill = true | ↗ |
See also Interpolation transformation in REST API.
Rate
| Name | Description | |
|---|---|---|
rate | Compute the difference between consecutive samples per period of time. If the period duration is zero, for example rate = 0, the rate function calculates the difference between consecutive samples, without adjusting it by the time difference between the samples.Format: count time_unit.Example: rate = 15 second | ↗ |
rate-counter | Possible values: false, true.Default value: trueIf true, negative differences between consecutive sample values are converted to 0.Example: rate-counter = true | ↗ |
See also Rate transformation in REST API.
Merging
| Name | Description | |
|---|---|---|
merge-series | Merge multiple series loaded with the same [series] section into one series. Duplicate samples with the same timestamp are discarded.Possible values: false, true.Default value: false (keep series separate).Example: merge-series = true | ↗ |
merge-fields | Merge series based on the specified field(s). Applies if merge-series is set to true.Possible values: entity - Combine series with the same entity into one.tag-name - Combine series with the same value for the specified tag into one series.Example: merge-fields = mount_point | ↗ |
Grouping
| Name | Description | |
|---|---|---|
group-statistic | Group statistic function applied to matching series. Note that DELTA and COUNTER functions are not supported by this transformation.Example: group-statistic = sum | ↗ |
group-period | Group period over which to calculate group statistics specified as the number of time units. Format: count time_unit.Default value: auto (inherited from period or set to 15 minute if period is not set.Example: group-period = 1 day | ↗ |
group-interpolate | Interpolate grouped values. Possible values: LINEAR, PREVIOUS, VALUE.Example: group-interpolate = LINEAR | ↗ |
group-interpolate-extend | Fill missing leading and trailing periods with NEXT or PREVIOUS values.Example: group-interpolate-extend = true | ↗ |
group-place-constraint | Boolean expression that series in each subgroup must satisfy. Example: group-place-constraint = max() < 10 | ↗ |
group-place-count | Maximum number of subgroups. The response can contain less than the maximum. Example: group-place-count = 5 | ↗ |
group-place-minimize | Objective function calculated for each subgroup. Partitioning into subgroups is performed to minimize the sum of function values. Example: group-place-minimize = stdev() | ↗ |
group-tags | List of tag names which determines how series are grouped. Default: null Example: group-tags = tag-1, tag-2 | ↗ |
group-place-method | The algorithm used to solve the packing problem. Possible values: greedy_correlations, greedy_simple.Default value: greedy_simple.Example: group-place-method = greedy_correlations | ↗ |
group-place-entities | Entities containing group-specific information using entity tags with numeric characteristics of a subgroup. Example: group-place-entities = lp_group_1, lp_group_2 | ↗ |
group-place-entity-group | Alternative to entities setting using an entity group name.Example: group-place-entity-group = servers | ↗ |
group-place-entity-expression | Alternative to entities setting using an expression.Example: group-place-entity-expression = nur* | ↗ |
group-keys | List of keys including entity, type, source, and custom tags to count messages by period.Example: group-keys = typegroup-keys = entity, type | ↗ |
See also Grouping transformation in REST API.
Downsampling
| Name | Description | |
|---|---|---|
downsample | Enable downsampling. Possible values: false, true.Default value: false.Example: downsample = true | ↗ |
downsample-gap | Frequency of repeated values defined as downsample-gap in time units.A larger gap value decreases the occurrence of repeated values. Possible values: count time_unit.Default value: 10 minute.Example: downsample-gap = 10 minute | ↗ |
downsample-ratio | Downsample ratio. Example: downsample-ratio = 1.1 | ↗ |
downsample-algorithm | Downsample algorithm used in calculation. Possible values: DETAIL, INTERPOLATE.Default value: DETAIL.Example: downsample-algorithm = interpolate | ↗ |
downsample-difference | Deviation between consecutive values which ATSD considers equivalent. Consolidate samples with minor deviations when downsampling. Example: downsample-difference = 4 | ↗ |
See also Downsampling transformation in REST API.
Smoothing
| Name | Description | |
|---|---|---|
smooth | Averaging function applied to window samples. Possible values: AVG, EMA, WAVG, WTAVG.Example: smooth = AVG | ↗ |
smooth-count | Window size. A larger window performs greater smoothing. Example: smooth-count = 50 | ↗ |
smooth-interval | Window duration interval, specified as the number of time units. Format: count time_unit.Example: smooth-interval = 15 minute | ↗ |
smooth-minimum-count | Minimum number of samples in a window required to apply the smoothing function. Default value: 1.Example: smooth-minimum-count = 10 | ↗ |
smooth-incomplete-value | Sample value returned when downsampling window is not full. Example: smooth-incomplete-value = NaN | ↗ |
smooth-factor | EMA smoothing parameter.EMA does not depend on the window size.In the presence of gaps, EMA reaction is delayed due to the missing prior values.Default value: 0.25.Possible values: (0, 1).Example: smooth-factor = 0.50 | ↗ |
smooth-range | EMA smoothing parameter, as an alternative to smooth-factor.The difference with the factor parameter appears when the samples are irregular.EMA does not depend on the window size.Example: smooth-range = 60000 | ↗ |
See also Smoothing transformation in REST API.
Forecasting
Shared Forecasting Settings
| Name | Description | |
|---|---|---|
forecast-include | Include input series, forecast, or reconstructed series into response. Possible values: RECONSTRUCTED, HISTORY, FORECAST.Default value: FORECAST.Example: forecast-include = HISTORY, FORECAST | ↗ |
forecast-horizon-interval | Generate a forecast for the specified interval into the future starting with last sample of the loaded series. The interval is specified as the number of time units. Format: count time_unit.Example: forecast-horizon-interval = 1 day | ↗ |
forecast-horizon-length | Generate a forecast for the specified number of samples into the future. Example: forecast-horizon-length = 30 | ↗ |
forecast-horizon-end-time | Generate a forecast starting with last sample of the loaded series and until the specified date in the future. Example: forecast-horizon-end-time = 2019-02-10T00:00:00Z | ↗ |
forecast-horizon-start-time | Generate a forecast for the specified interval into the future starting with specified date instead of the last sample of the loaded series. Example: forecast-horizon-start-time = 2019-02-10T00:00:00Z | ↗ |
forecast-score-interval | Interval for scoring the produced forecasts ending with the last sample of the input series. The interval is specified as the number of time units. Format: count time_unit.For SSA, the default value is the minimum of forecast-horizon-interval and 1/3 of the loaded series duration.For ARIMA and Holt-Winters the default value is 1/4 of the loaded series duration.Example: forecast-score-interval = 1 day | ↗ |
The settings
forecast-horizon-interval,forecast-horizon-length, andforecast-horizon-end-timeare mutually exclusive. See also Forecasting transformation in REST API.
ARIMA Forecasting Settings
| Name | Description | |
|---|---|---|
forecast-arima-auto | Generate an ARIMA forecast using optimal settings. If true, ARIMA parameters p and d are selected automatically based on scoring.If set to false, parameters p, d are required.Example: forecast-arima-auto = true | ↗ |
forecast-arima-p | Auto-regression parameter p.Example: forecast-arima-p = 10 | ↗ |
forecast-arima-auto-regression-interval | Alternative parameter for p where p is calculated as auto-regression-interval / interval.Specified as the number of time units. Format: count time_unit.Example: forecast-arima-auto-regression-interval = 1 day | ↗ |
forecast-arima-d | Integration parameter d, a number of 0 or 1.Example: forecast-arima-d = 0 | ↗ |
Holt-Winters Forecasting Settings
| Name | Description | |
|---|---|---|
forecast-hw-auto | Generate a Holt-Winters forecast using optimal settings. If true Holt-Winters parameters alpha, beta, gamma are selected automatically based on scoring.If set to false, parameters alpha, beta, gamma are required.Example: forecast-hw-auto = true | ↗ |
forecast-hw-alpha | Holt-Winters alpha (data) parameter.Possible values: [0, 1]. | ↗ |
forecast-hw-beta | Holt-Winters beta (trend) parameter.Possible values: [0, 1]. | ↗ |
forecast-hw-gamma | Holt-Winters gamma (seasonality) parameter.Possible values: [0, 1]. | ↗ |
forecast-hw-period | Series period (seasonality) parameter. The interval is specified as the number of time units. Format: count time_unit.Example: forecast-hw-period = 1 hour | ↗ |
SSA Forecasting Settings
| Name | Description | |
|---|---|---|
forecast-ssa | Generate an SSA (singular spectrum analysis) forecast. Example: forecast-ssa = true | ↗ |
forecast-ssa-decompose-eigentriple-limit | Maximum number of eigenvectors extracted from the trajectory matrix during the singular value decomposition (SVD). Possible values: between 0 and 500.If set to 0, the count is determined automatically.Example: forecast-decompose-eigentriple-limit = 50 | ↗ |
forecast-ssa-decompose-method | The algorithm applied in singular value decomposition (SVD) of the trajectory matrix to extract eigenvectors. Possible values: FULL, TRUNCATED, AUTO.Example: forecast-ssa-decompose-method = TRUNCATED | ↗ |
forecast-ssa-decompose-window-length | Height (row count) of the trajectory matrix, specified as the % of the sample count in the input series. Possible values: (0, 50].Default value: 50.Example: forecast-ssa-decompose-window-length = 50 | ↗ |
forecast-ssa-decompose-singular-value-threshold | Threshold, specified in percent, to discard small eigenvectors. Eigenvector with eigenvalue λ is discarded if √λ is less than the specified % of √ sum of all eigenvalues. Discard if √λ ÷ √ (∑ λi) < threshold ÷ 100If threshold is 0, no vectors are discarded.Possible values: [0, 100).Example: forecast-ssa-decompose-singular-value-threshold = 5 | ↗ |
forecast-ssa-group-auto-count | Maximum number of eigenvector groups. The eigenvectors are placed into groups by the clustering method in Auto mode, or using by enumerating eigenvector indexes in Manual mode. The groups are sorted by maximum eigenvalue in descending order and are named with letters A, B, C etc.If set to 0, only one group is returned.Example: forecast-ssa-group-auto-count = 5 | ↗ |
forecast-ssa-group-auto-stack | Build groups recursively, starting with the group A with maximum eigenvalue, to view the cumulative effect of added eigenvectors. In enabled, group A contains its own eigenvectors. Group B contains its own eigenvectors as well as eigenvectors from group A. Group C includes its own eigenvectors as well as eigenvectors from group A and B, etc.Example: forecast-ssa-group-auto-stack = true | ↗ |
forecast-ssa-group-auto-clustering-method | Algorithm used to place eigenvectors into groups. Possible values: HIERARCHICAL, XMEANS, NOVOSIBIRSK.Default value: HIERARCHICAL.Example: forecast-ssa-group-auto-clustering-method = HIERARCHICAL | ↗ |
forecast-ssa-group-auto-clustering-params | Dictionary (map) of parameters required by the given clustering method. Example: forecast-ssa-group-auto-clustering-params = { "v": 0.8, "c": 0.8 } | ↗ |
forecast-ssa-group-auto-union | Join eigenvectors from automatically created groups into custom groups. Multiple custom groups are separated using comma. Groups within the custom group are enumerated using semi-colon as a separator or hyphen for range. For example, custom group A;B;D contains eigenvectors from automatic groups A, B and D. Custom group A;C-E contains eigenvectors from automatic groups A,C,D,E.Example: forecast-ssa-group-auto-union = A;C-E , B;F- (two groups) | ↗ |
forecast-ssa-group-manual-groups | Join eigenvectors using their index into custom groups. Multiple custom groups are separated using comma. Eigenvectors within the same group are enumerated using semi-colon as a separator or hyphen for range. For example, custom group 1;3-6 contains eigenvectors with indexes 1, 3, 4, 5 and 6.Example: forecast-ssa-group-manual-groups = 1;3-6 , 2;7- | ↗ |
forecast-ssa-reconstruct-averaging-function | Averaging function to calculate anti-diagonal elements of the reconstructed matrix. Possible values: AVG, MEDIAN.Default value: AVGExample: forecast-ssa-reconstruct-averaging-function = AVG | ↗ |
forecast-ssa-reconstruct-fourier | Use Fourier transform in the reconstruction stage and in SVD (singular value decomposition). Default value: true.Example: forecast-ssa-reconstruct-fourier = true | ↗ |
forecast-ssa-forecast-method | Forecast calculation method. Possible values: RECURRENT, VECTOR.Default value: RECURRENT.Example: forecast-ssa-forecast-method = RECURRENT | ↗ |
forecast-ssa-forecast-base | Input series to which the recurrent formula is applied when calculating the forecast. Possible values: RECONSTRUCTED, ORIGINAL.Example: forecast-ssa-forecast-base = RECONSTRUCTED | ↗ |
Derived Value Settings
Specify value setting to create calculated series derived from raw series using arithmetic expressions in JavaScript syntax.
The expression must return a number or null. Samples with null values are hidden.
| Name | Description | |
|---|---|---|
alias | Unique series name to pass data to other series. Used as default label if no label and label-format settings are specified. Example: alias = s1 | ↗ |
value | Formula to calculate derived values at each timestamp of the other series identified by alias. The formula can include value functions. Example: value = max('s1') - 10 | ↗ |
replace-value | Formula to replace values in the current series. Supported fields: value, time, previousValue, previousTime.Unlike value setting, creating and referring to another series is not required.Example: replace-value = Math.log(value) | ↗ ↗ |
fill-value | Interpolate a missing value for the given timestamp when merging multiple series with different timestamps using specified interpolation type. Possible values: NONE, PREVIOUS, LINEAR.Default value: LINEAR.Example: fill-value = PREVIOUS | ↗ |